2001 New Jersey Senate election
The 2001 New Jersey State Senate elections were held on November 6.
| |||||||||||||||||||||||||
All 40 seats in the New Jersey State Senate 21 seats needed for a majority | |||||||||||||||||||||||||
|---|---|---|---|---|---|---|---|---|---|---|---|---|---|---|---|---|---|---|---|---|---|---|---|---|---|
| |||||||||||||||||||||||||
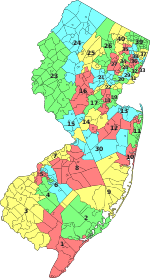
 Results by district Democratic hold Democratic gain Republican hold | |||||||||||||||||||||||||
| |||||||||||||||||||||||||

.jpg)
The election took place alongside Jim McGreevey's landslide election as Governor of New Jersey and were held in the immediate aftermath of the September 11 attacks, which killed 750 New Jerseyans[1] and impacted many others. Under a newly redrawn map, Democrats gained five seats to split control of the Senate evenly. A power-sharing agreement was reached with John O. Bennett and Richard Codey as co-presidents of the Senate.
This is the last time Democrats did not win an outright majority of New Jersey State Senate seats, as well as the last time any Senate in North Jersey changed parties.
| Contents Incumbents not running • Summary of results By District: 1 • 2 • 3 • 4 • 5 • 6 • 7 • 8 • 9 • 10 • 11 • 12 • 13 • 14 • 15 • 16 • 17 • 18 • 19 • 20 • 21 • 22 • 23 • 24 • 25 • 26 • 27 • 28 • 29 • 30 • 31 • 32 • 33 • 34 • 35 • 36 • 37 • 38 • 39 • 40 |
Background edit
Redistricting edit

As required, the New Jersey legislature redistricted its state legislative districts in advance of the 2001 election. Most Senators remained in their existing districts, though Senator Kevin J. O'Toole was redistricted to the 40th district and chose not to challenge.
The new map was based on a revised Democratic map chosen by Professor Larry Bartels of Princeton University, the non-partisan member of the reapportionment commission.[2]
Republicans challenged the district map under the Voting Rights Act of 1965, arguing that by shifting some African-American and Hispanic voters out of three predominantly minority districts in and around Newark and spreading them to other, mostly white districts, the plan diluted minority voting strength. The case was rejected by the U.S. Court for the District of New Jersey.[2] The Republican suit was dismissed partly under the influence of the near-unanimous support of New Jersey's incumbent minority legislators for the Democratic claim that their map would result in more minority representation, rather than less.[2]
Incumbents not running for re-election edit
Democratic edit
- John A. Lynch Jr. (District 17)
Republican edit
- Jack Sinagra (District 18) (resigned October 23)
- Kevin O'Toole (District 21) (redistricted into District 40; ran for Assembly)
- Donald DiFrancesco (District 22) (ran for Governor)
- William E. Schluter (District 23) (redistricted into District 15; ran for Governor as an Independent)
Summary of results by State Senate district edit
Close races edit
Seats where the margin of victory was under 10%:
- Legislative District 1, 0.8%
- Legislative District 3, 3.0% gain
- Legislative District 7, 8.2%
- Legislative District 14, 4.2%
- Legislative District 36, 3.0%
- Legislative District 38, 6.2%
- ^ Senator Zane switched from the Democratic Party to the Republican Party in February 2001.
- ^ Senator Jack Sinagra resigned on October 23, 2001, to become chairman of the Port Authority of New York and New Jersey.
- ^ O'Toole was appointed to the Senate after Senator C. Louis Bassano resigned to join the New Jersey Sports and Exposition Authority.
- ^ Redistricted to 40th district.
- ^ James was appointed in June 1999 to complete the unexpired term of Senator Wynona Lipman. He won a special election for the seat in 1999.
District 1 edit
| Party | Candidate | Votes | % | |
|---|---|---|---|---|
| Republican | James Cafiero (incumbent) | 31,150 | 50.4 | |
| Democratic | William J. Hughes, Jr. | 30,709 | 49.6 | |
| Total votes | 61,859 | 100.00% | ||
District 2 edit
| Party | Candidate | Votes | % | |
|---|---|---|---|---|
| Republican | William Gormley (incumbent) | 34,786 | 86.5 | |
| Green | David Alcantara | 5,411 | 13.5 | |
| Total votes | 40,197 | 100.00% | ||
District 3 edit
| Party | Candidate | Votes | % | |
|---|---|---|---|---|
| Democratic | Stephen M. Sweeney | 29,873 | 51.5 | |
| Republican | Raymond Zane (incumbent) | 28,138 | 48.5 | |
| Total votes | 58,011 | 100.00% | ||
District 4 edit
| Party | Candidate | Votes | % | |
|---|---|---|---|---|
| Republican | John J. Matheussen (incumbent) | 28,530 | 58.2 | |
| Democratic | Joseph L. Manganello | 20,451 | 41.8 | |
| Total votes | 48,981 | 100.00% | ||
District 5 edit
| Party | Candidate | Votes | % | |
|---|---|---|---|---|
| Democratic | Wayne R. Bryant (incumbent) | 29,568 | 69.3 | |
| Republican | Maryann T. Callahan | 13,087 | 30.7 | |
| Total votes | 42,655 | 100.00% | ||
District 6 edit
| Party | Candidate | Votes | % | |
|---|---|---|---|---|
| Democratic | John Adler (incumbent) | 39,336 | 66.7 | |
| Republican | Jane A. Greenfogel | 19,635 | 33.3 | |
| Total votes | 58,971 | 100.00% | ||
District 7 edit
| Party | Candidate | Votes | % | |
|---|---|---|---|---|
| Republican | Diane Allen (incumbent) | 29,756 | 54.1 | |
| Democratic | Lou Gallagher | 25,293 | 45.9 | |
| Total votes | 55,049 | 100.00% | ||
District 8 edit
| Party | Candidate | Votes | % | |
|---|---|---|---|---|
| Republican | Martha W. Bark (incumbent) | 35,276 | 60.7 | |
| Democratic | Gary E. Haman | 22,865 | 39.3 | |
| Total votes | 58,141 | 100.00% | ||
District 9 edit
| Party | Candidate | Votes | % | |
|---|---|---|---|---|
| Republican | Leonard T. Connors (incumbent) | 43,303 | 58.7% | |
| Democratic | Peter A. Terranova | 29,885 | 40.5% | |
| Common Sense Independent | Mark Schreckenstein | 588 | 0.8% | |
| Total votes | 73,776 | 100.00% | ||
District 10 edit
| Party | Candidate | Votes | % | |
|---|---|---|---|---|
| Republican | Andrew R. Ciesla (incumbent) | 36,329 | 56.8% | |
| Democratic | Timothy E. Ryan | 27,609 | 43.2% | |
| Total votes | 63,938 | 100.00% | ||
District 11 edit
| Party | Candidate | Votes | % | |
|---|---|---|---|---|
| Republican | Joseph A. Palaia (incumbent) | 36,385 | 62.0% | |
| Democratic | Maureen O'Rourke | 22,261 | 38.0% | |
| Total votes | 58,646 | 100.00% | ||
District 12 edit
| Party | Candidate | Votes | % | |
|---|---|---|---|---|
| Republican | John O. Bennett (incumbent) | 34,464 | 58.8% | |
| Democratic | Amy I. Aughenbaugh | 24,189 | 41.2% | |
| Total votes | 58,653 | 100.00% | ||
District 13 edit
| Party | Candidate | Votes | % | |
|---|---|---|---|---|
| Republican | Joe Kyrillos (incumbent) | 38,089 | 64.4% | |
| Democratic | Kiran Desai | 21,066 | 35.6% | |
| Total votes | 59,155 | 100.00% | ||
District 14 edit
| Party | Candidate | Votes | % | |
|---|---|---|---|---|
| Republican | Peter Inverso (incumbent) | 32,034 | 52.1% | |
| Democratic | Sam Plumeri Jr. | 29,458 | 47.9% | |
| Total votes | 61,492 | 100.00% | ||
District 15 edit
| Party | Candidate | Votes | % | |
|---|---|---|---|---|
| Democratic | Shirley Turner (incumbent) | 32,289 | 69.1% | |
| Republican | Norbert E. Donelly | 13,871 | 29.7% | |
| Libertarian | Thomas D. Abrams | 563 | 1.2% | |
| Total votes | 46,723 | 100.00% | ||
District 16 edit
| Party | Candidate | Votes | % | |
|---|---|---|---|---|
| Republican | Walter J. Kavanaugh (incumbent) | 39,073 | 66.6% | |
| Democratic | Daniel Wartenberg | 19,589 | 33.4% | |
| Total votes | 58,662 | 100.00% | ||
District 17 edit
| Party | Candidate | Votes | % | |
|---|---|---|---|---|
| Democratic | Bob Smith | 29,290 | 68.9 | |
| Republican | Matthew "Skip" House | 13,216 | 31.1 | |
| Total votes | 42,506 | 100.00% | ||
District 18 edit
| Party | Candidate | Votes | % | |
|---|---|---|---|---|
| Democratic | Barbara Buono | 33,487 | 65.0 | |
| Republican | John G. Cito | 18,064 | 35.0 | |
| Total votes | 51,551 | 100.00% | ||
District 19 edit
| Party | Candidate | Votes | % | |
|---|---|---|---|---|
| Democratic | Joe Vitale (incumbent) | 37,322 | 77.4% | |
| Republican | Naresh "Nick" Gidwani | 10,928 | 22.6% | |
| Total votes | 48,250 | 100.00% | ||
District 20 edit
| Party | Candidate | Votes | % | |
|---|---|---|---|---|
| Democratic | Raymond J. Lesniak | 22,817 | 80.0% | |
| Schundler for Governor | Daniel M. Nozza | 5,698 | 20.0% | |
| Total votes | 28,515 | 100.0 | ||
District 21 edit
| Party | Candidate | Votes | % | |
|---|---|---|---|---|
| Republican | Richard Bagger | 41,539 | 58.6% | |
| Democratic | Ellen Steinberg | 29,342 | 41.4% | |
| Total votes | 70,881 | 100.00% | ||
District 22 edit
| Party | Candidate | Votes | % | |
|---|---|---|---|---|
| Democratic | Joseph S. Suliga | 29,326 | 59.1 | |
| Republican | Milton Campbell | 20,330 | 40.9 | |
| Total votes | 49,656 | 100.00% | ||
District 23 edit
| Party | Candidate | Votes | % | |
|---|---|---|---|---|
| Republican | Leonard Lance | 43,721 | 69.3 | |
| Democratic | Frederick P. Cook | 19,407 | 30.7 | |
| Total votes | 63,128 | 100.00% | ||
District 24 edit
| Party | Candidate | Votes | % | |
|---|---|---|---|---|
| Republican | Robert Littell (incumbent) | 41,019 | 74.4% | |
| Democratic | Edwin Selby | 14,117 | 25.6% | |
| Total votes | 55,136 | 100.00% | ||
District 25 edit
| Party | Candidate | Votes | % | |
|---|---|---|---|---|
| Republican | Anthony R. Bucco (incumbent) | 38,020 | 65.5% | |
| Democratic | Horace Chamberlain | 20,017 | 34.5% | |
| Total votes | 58,037 | 100.00% | ||
District 26 edit
| Party | Candidate | Votes | % | |
|---|---|---|---|---|
| Republican | Robert Martin (incumbent) | 38,779 | 65.9% | |
| Democratic | Paul E. Pinney | 20,090 | 34.1% | |
| Total votes | 58,869 | 100.00% | ||
District 27 edit
| Party | Candidate | Votes | % | |
|---|---|---|---|---|
| Democratic | Richard J. Codey | 35,237 | 64.7 | |
| Republican | Jared Silverman | 17,871 | 32.8 | |
| African-Americans For Justice | Donald Page | 1,359 | 2.5 | |
| Total votes | 54,467 | 100.00% | ||
District 28 edit
| Party | Candidate | Votes | % | |
|---|---|---|---|---|
| Democratic | Ronald Rice (incumbent) | 27,294 | 69.4% | |
| Republican | Marion Crecco | 11,646 | 29.6% | |
| Independent | Brian E. Coleman | 403 | 1.0 | |
| Total votes | 39,343 | 100.00% | ||
District 29 edit
| Party | Candidate | Votes | % | |
|---|---|---|---|---|
| Democratic | Sharpe James (incumbent) | 25,510 | 100.0% | |
| Total votes | 25,510 | 100.00% | ||
District 30 edit
| Party | Candidate | Votes | % | |
|---|---|---|---|---|
| Republican | Robert Singer (incumbent) | 31,671 | 61.7% | |
| Democratic | Timothy J. Konopka | 19,690 | 38.3% | |
| Total votes | 51,361 | 100.00% | ||
District 31 edit
| Party | Candidate | Votes | % | |
|---|---|---|---|---|
| Democratic | Joseph Charles | 29,401 | 74.1% | |
| Republican | Martin J. McFadden | 10,250 | 25.9% | |
| Total votes | 39,651 | 100.00% | ||
District 32 edit
| Party | Candidate | Votes | % | |
|---|---|---|---|---|
| Democratic | Nicholas Sacco (incumbent) | 26,991 | 69.0% | |
| Republican | Frank MacCormack | 11,514 | 29.4% | |
| Politicians Are Crooks | Herbert H. Shaw | 396 | 1.0% | |
| Eliminate Primary Elections | Louis Vernotico | 196 | 0.5% | |
| Total votes | 39,097 | 100.00% | ||
District 33 edit
| Party | Candidate | Votes | % | |
|---|---|---|---|---|
| Democratic | Bernard Kenny (incumbent) | 28,659 | 75.3% | |
| Republican | Nancy Gaynor | 9,378 | 24.7% | |
| Total votes | 38,037 | 100.00% | ||
District 34 edit
| Party | Candidate | Votes | % | |
|---|---|---|---|---|
| Democratic | Nia Gill | 30,453 | 64.9% | |
| Republican | Norman M. Robertson (incumbent) | 16,135 | 34.4% | |
| Social Economic Empowerment | Marie Yvrose Celestin | 368 | 0.8 | |
| Total votes | 46,956 | 100.00% | ||
District 35 edit
| Party | Candidate | Votes | % | |
|---|---|---|---|---|
| Democratic | John Girgenti (incumbent) | 25,844 | 100.0% | |
| Total votes | 25,844 | 100.00% | ||
District 36 edit
| Party | Candidate | Votes | % | |
|---|---|---|---|---|
| Democratic | Garry Furnari (incumbent) | 22,914 | 50.8% | |
| Republican | John V. Kelly | 21,571 | 47.8% | |
| Green Coalition | Joseph Farallo | 642 | 1.4 | |
| Total votes | 45,127 | 100.00% | ||
District 37 edit
| Party | Candidate | Votes | % | |
|---|---|---|---|---|
| Democratic | Byron Baer (incumbent) | 33,650 | 66.4% | |
| Republican | Jonathan L. Bender | 17,037 | 33.6% | |
| Total votes | 50,687 | 100.00% | ||
District 38 edit
| Party | Candidate | Votes | % | |
|---|---|---|---|---|
| Democratic | Joseph Coniglio | 29,316 | 53.2% | |
| Republican | Louis F. Kosco (incumbent) | 25,773 | 46.8% | |
| Total votes | 55,089 | 100.00% | ||
District 39 edit
| Party | Candidate | Votes | % | |
|---|---|---|---|---|
| Republican | Gerald Cardinale (incumbent) | 42,717 | 62.9% | |
| Democratic | Alan Baskin | 24,543 | 36.2% | |
| Conservative | George E. Soroka | 616 | 0.9% | |
| Total votes | 67,876 | 100.00% | ||
District 40 edit
| Party | Candidate | Votes | % | |
|---|---|---|---|---|
| Republican | Henry McNamara (incumbent) | 39,815 | 62.3% | |
| Democratic | Jack Nigro | 24,122 | 37.7% | |
| Total votes | 63,937 | 100.00% | ||
References edit
- ^ Hochman, Louis (September 10, 2020). "NEW JERSEY'S 750 VICTIMS OF 9/11 — WE'LL NEVER FORGET THEM".
- ^ a b c "New Jersey's Redistricting". The New York Times. May 9, 2001. p. 30.
- ^ a b c d e f g h i j k l m n o p q r s t u v w x y z aa ab ac ad ae af ag ah ai aj ak al am an "Official List, Candidate Returns for State Senate for November 2001 General Election" (PDF). Archived from the original (PDF) on March 4, 2016. Retrieved December 3, 2015.