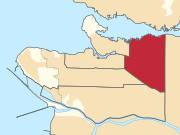
Vancouver East (French: Vancouver-Est) is a federal electoral district in British Columbia, Canada, that has been represented in the House of Commons of Canada since 1935. It is currently represented by New Democratic Party MP Jenny Kwan.
 Vancouver East in relation to other electoral districts in Vancouver | |||
| Federal electoral district | |||
| Legislature | House of Commons | ||
| MP |
New Democratic | ||
| District created | 1933 | ||
| First contested | 1935 | ||
| Last contested | 2021 | ||
| District webpage | profile, map | ||
| Demographics | |||
| Population (2021)[1] | 118,675 | ||
| Electors (2015) | 85,900 | ||
| Area (km²)[1] | 21.66 | ||
| Pop. density (per km²) | 5,479 | ||
| Census division(s) | Metro Vancouver | ||
| Census subdivision(s) | Vancouver | ||
The riding of Vancouver East is the poorest in Canada with a median individual income of $24,374 (2010).
Vancouver East is known as a New Democratic Party stronghold; the NDP and its Co-operative Commonwealth Federation predecessor have won all but two elections in the riding since its creation in 1933. Both losses (1974 and 1993) have come at the hands of Liberal candidates who failed to retain the seat at the next election. The Conservative Party and its right-leaning predecessors have always fared poorly in the riding, rarely garnering more than 20 percent of the vote.
In the 2006 federal election, the NDP won a higher percentage of the vote in Vancouver East than in any other riding in the country: 56.6%. In 2011 the NDP increased its majority win to 62.83%.
Geography edit
The district includes the City of Vancouver's Downtown Eastside, Mount Pleasant, Grandview–Woodland, and Hastings–Sunrise.
Federal riding associations edit
Riding associations are the local branches of the national political parties:
| Party | Association name | CEO | HQ address | Neighbourhood | |
| Green | Green Party of Canada Vancouver East Electoral District Association | Jim Hankle | 210 West Hastings Street | Downtown Eastside | |
| Conservative | Vancouver East Conservative Association | Edward Sem | 3189 East 4th Avenue | Hastings–Sunrise | |
| Liberal | Vancouver East Federal Liberal Association | Mark Elyas | 460-580 Hornby St. | Financial District | |
| New Democratic | Vancouver East Federal NDP Riding Association | Caelan Griffiths | 138-2416 Main Street | Mount Pleasant | |
| Marijuana | Vancouver East Parti Marijuana Party Electoral District Association | Dan Crysler | 240-2915 Kaslo Street | Renfrew Heights | |
Demographics edit
Though Vancouver East is home to a predominantly impoverished underclass populace, it is also however, home to a prominent industrial and working-class riding. The district is well-known for hosting North America's largest Chinatown in addition to being one of the poorest areas in the Metro Vancouver District, known as the Downtown Eastside. 42% of the riding's inhabitants are immigrants and 22% are of Chinese ancestry. A high number, 63%, of residents are renters, compared to only 37% home owners. 24% of residents over age 25 have a university certificate or degree. Manufacturing, tourism, shipping, accommodation and food service industries are vital to the employment base in this riding. The average family income is over $61,000 CAD. The unemployment rate is about 7.7%.[2]
The ethnically diverse area is home to many of the city's artists and socio-political activists. In recent years, the area has been negatively affected by an influx of hard drugs and the concomitant social consequences associated with their use.
The riding is the least religious in Canada, with 55.1% of the population not adhering to any religion.[3]
| Panethnic group | 2021[4] | 2016[5] | 2011[6] | |||||||||||
|---|---|---|---|---|---|---|---|---|---|---|---|---|---|---|
| Pop. | % | Pop. | % | Pop. | % | |||||||||
| European[a] | 58,615 | 51.5% | 58,580 | 53.3% | 52,315 | 50.34% | ||||||||
| East Asian[b] | 25,600 | 22.49% | 26,880 | 24.46% | 27,590 | 26.55% | ||||||||
| Southeast Asian[c] | 9,270 | 8.15% | 8,975 | 8.17% | 10,500 | 10.1% | ||||||||
| Indigenous | 5,940 | 5.22% | 5,880 | 5.35% | 5,055 | 4.86% | ||||||||
| South Asian | 3,850 | 3.38% | 2,760 | 2.51% | 2,310 | 2.22% | ||||||||
| Latin American | 3,330 | 2.93% | 1,975 | 1.8% | 1,950 | 1.88% | ||||||||
| African | 2,165 | 1.9% | 1,685 | 1.53% | 1,445 | 1.39% | ||||||||
| Middle Eastern[d] | 1,710 | 1.5% | 1,065 | 0.97% | 835 | 0.8% | ||||||||
| Other[e] | 3,320 | 2.92% | 2,115 | 1.92% | 1,925 | 1.85% | ||||||||
| Total responses | 113,805 | 95.9% | 109,905 | 94.97% | 103,920 | 94.39% | ||||||||
| Total population | 118,675 | 100% | 115,724 | 100% | 110,097 | 100% | ||||||||
| Notes: Totals greater than 100% due to multiple origin responses. Demographics based on 2012 Canadian federal electoral redistribution riding boundaries. | ||||||||||||||
History edit
The electoral district was created in 1933 from Vancouver South and Vancouver—Burrard ridings.
Vancouver East was one two electoral districts in British Columbia that saw no changes to its boundaries proposed following the 2012 federal electoral boundaries redistribution.
Historical boundaries edit
-
 1933 representation order
 -
 1947 representation order
 -
 1952 representation order
 -
 1966 representation order
 -
 1976 representation order
 -
 1987 representation order
 -
 1996 representation order
 -
 2003 representation order
 -
 2013 representation order
 -
 2023 representation order


.svg)


Members of Parliament edit
| Parliament | Years | Member | Party | |
|---|---|---|---|---|
| Vancouver East Riding created from Vancouver South and Vancouver—Burrard |
||||
| 18th | 1935–1940 | Angus MacInnis | Co-operative Commonwealth | |
| 19th | 1940–1945 | |||
| 20th | 1945–1949 | |||
| 21st | 1949–1953 | |||
| 22nd | 1953–1957 | Harold Edward Winch | ||
| 23rd | 1957–1958 | |||
| 24th | 1958–1961 | |||
| 1961–1962 | New Democratic | |||
| 25th | 1962–1963 | |||
| 26th | 1963–1965 | |||
| 27th | 1965–1968 | |||
| 28th | 1968–1972 | |||
| 29th | 1972–1974 | Paddy Neale | ||
| 30th | 1974–1979 | Art Lee | Liberal | |
| 31st | 1979–1980 | Margaret Mitchell | New Democratic | |
| 32nd | 1980–1984 | |||
| 33rd | 1984–1988 | |||
| 34th | 1988–1993 | |||
| 35th | 1993–1997 | Anna Terrana | Liberal | |
| 36th | 1997–2000 | Libby Davies | New Democratic | |
| 37th | 2000–2004 | |||
| 38th | 2004–2006 | |||
| 39th | 2006–2008 | |||
| 40th | 2008–2011 | |||
| 41st | 2011–2015 | |||
| 42nd | 2015–2019 | Jenny Kwan | ||
| 43rd | 2019–2021 | |||
| 44th | 2021–present | |||
Current member of Parliament edit
Its member of Parliament (MP) is Jenny Kwan. She is a member of the New Democratic Party.
Election results edit
Graphs are unavailable due to technical issues. There is more info on Phabricator and on MediaWiki.org. |
| 2021 Canadian federal election | ||||||||
|---|---|---|---|---|---|---|---|---|
| Party | Candidate | Votes | % | ±% | Expenditures | |||
| New Democratic | Jenny Kwan | 27,969 | 56.4 | $70,443.58 | ||||
| Liberal | Josh Vander Vies | 9,797 | 19.8 | $41,387.88 | ||||
| Conservative | Mauro Francis | 5,399 | 10.9 | $9,491.11 | ||||
| Green | Cheryl Matthew | 3,826 | 7.7 | $5,835.22 | ||||
| People's | Karin Litzcke | 1,382 | 2.8 | $3,823.14 | ||||
| Libertarian | Gölök Buday | 831 | 1.7 | $0.00 | ||||
| Communist | Natasha Hale | 387 | 0.8 | $0.00 | ||||
| Total valid votes/expense limit | 45,591 | – | – | $119,373.85 | ||||
| Total rejected ballots | 528 | |||||||
| Turnout | ||||||||
| Eligible voters | ||||||||
| Source: Elections Canada[7] | ||||||||
| 2019 Canadian federal election | ||||||||
|---|---|---|---|---|---|---|---|---|
| Party | Candidate | Votes | % | ±% | Expenditures | |||
| New Democratic | Jenny Kwan | 29,236 | 52.6 | +2.66 | $86,021.45 | |||
| Liberal | Kyle Demes | 10,085 | 18.1 | -10.06 | $25,852.88 | |||
| Green | Bridget Burns | 8,062 | 14.5 | +5.31 | $51,975.81 | |||
| Conservative | Chris Corsetti | 6,724 | 12.1 | +1.33 | $4,528.19 | |||
| People's | Karin Litzcke | 679 | 1.2 | – | $7,718.34 | |||
| Libertarian | Gölök Z. Buday | 562 | 1.0 | – | $182.20 | |||
| Communist | Peter Marcus | 177 | 0.3 | -0.59 | $476.56 | |||
| Marxist–Leninist | Anne Jamieson | 86 | 0.2 | -0.16 | $0.00 | |||
| Total valid votes/expense limit | 55,611 | 100.0 | ||||||
| Total rejected ballots | 537 | |||||||
| Turnout | 56,148 | 61.1 | ||||||
| Eligible voters | 91,951 | |||||||
| New Democratic hold | Swing | +6.36 | ||||||
| Source: Elections Canada[8][9] | ||||||||
| 2015 Canadian federal election: Vancouver East | ||||||||
|---|---|---|---|---|---|---|---|---|
| Party | Candidate | Votes | % | ±% | Expenditures | |||
| New Democratic | Jenny Kwan | 29,316 | 49.94 | -12.89 | $107,948.45 | |||
| Liberal | Edward Wong | 16,532 | 28.16 | +18.25 | $103,236.57 | |||
| Conservative | James Low | 6,322 | 10.77 | -8.13 | $10,430.75 | |||
| Green | Wes Regan | 5,395 | 9.19 | +1.54 | $29,914.97 | |||
| Communist | Peter Marcus | 525 | 0.89 | – | – | |||
| Independent | D. Alex Millar | 216 | 0.37 | – | – | |||
| Marxist–Leninist | Anne Jamieson | 214 | 0.36 | -0.35 | – | |||
| Pirate | Shawn Vulliez | 188 | 0.32 | – | – | |||
| Total valid votes/Expense limit | 58,708 | 100.00 | $226,454.95 | |||||
| Total rejected ballots | 405 | 0.69 | – | |||||
| Turnout | 59,113 | 67.44 | – | |||||
| Eligible voters | 87,657 | |||||||
| New Democratic hold | Swing | -15.57 | ||||||
| Source: Elections Canada[10][11][12] | ||||||||
| 2011 Canadian federal election: Vancouver East | ||||||||
|---|---|---|---|---|---|---|---|---|
| Party | Candidate | Votes | % | ±% | ||||
| New Democratic | Libby Davies | 27,794 | 62.83 | +8.41 | ||||
| Conservative | Irene Yatco | 8,361 | 18.90 | +3.37 | ||||
| Liberal | Roma Ahi | 4,382 | 9.91 | -7.32 | ||||
| Green | Douglas Roy | 3,383 | 7.65 | -3.73 | ||||
| Marxist–Leninist | Anne Jamieson | 318 | 0.72 | +0.31 | ||||
| Total valid votes | 44,238 | 100.0 | ||||||
| Total rejected ballots | 275 | 0.62 | +0.03 | |||||
| Turnout | 44,513 | 56.21 | +2 | |||||
| Eligible voters | 79,184 | |||||||
| New Democratic hold | Swing | +2.52 | ||||||
| 2008 Canadian federal election: Vancouver East | ||||||||
|---|---|---|---|---|---|---|---|---|
| Party | Candidate | Votes | % | ±% | Expenditures | |||
| New Democratic | Libby Davies | 22,506 | 54.42 | -2.15 | $72,187 | |||
| Liberal | Ken Low | 7,127 | 17.23 | -6.19 | $80,088 | |||
| Conservative | Ryan Warawa | 6,422 | 15.53 | +2.22 | $45,821 | |||
| Green | Mike Carr | 4,708 | 11.38 | +5.38 | $2,396 | |||
| Work Less | Betty Krawczyk | 423 | 1.02 | – | ||||
| Marxist–Leninist | Anne Jamieson | 171 | 0.41 | – | ||||
| Total valid votes/Expense limit | 41,357 | 100.0 | $83,047 | |||||
| Total rejected ballots | 270 | 0.65 | +0.18 | |||||
| Turnout | 41,639 | 54 | -2.4 | |||||
| New Democratic hold | Swing | +2.02 | ||||||
| 2006 Canadian federal election | ||||||||
|---|---|---|---|---|---|---|---|---|
| Party | Candidate | Votes | % | ±% | Expenditures | |||
| New Democratic | Libby Davies | 23,927 | 56.57 | +0.11 | $75,177 | |||
| Liberal | Dave Haggard | 9,907 | 23.42 | -2.50 | $22,205 | |||
| Conservative | Elizabeth M. Pagtakhan | 5,631 | 13.31 | +3.32 | $76,377 | |||
| Green | Christine Ellis | 2,536 | 6.00 | +0.31 | $156 | |||
| Canadian Action | Bryce Bartholomew | 293 | 0.69 | – | $200 | |||
| Total valid votes | 42,294 | 100.0 | ||||||
| Total rejected ballots | 200 | 0.47 | -0.26 | |||||
| Turnout | 42,494 | 56.4 | -1.76 | |||||
| New Democratic hold | Swing | +1.30 | ||||||
| 2004 Canadian federal election | ||||||||
|---|---|---|---|---|---|---|---|---|
| Party | Candidate | Votes | % | ±% | Expenditures | |||
| New Democratic | Libby Davies | 23,452 | 56.46 | +14.19 | $64,940 | |||
| Liberal | Shirley Chan | 10,768 | 25.92 | -7.81 | ||||
| Conservative | Harvey Grigg | 4,153 | 9.99 | -7.53 | $44,993 | |||
| Green | Ron Plowright | 2,365 | 5.69 | +3.24 | $1,157 | |||
| Marijuana | Marc Boyer | 399 | 0.96 | -0.85 | ||||
| Christian Heritage | Gloria Anne Kieler | 250 | 0.60 | +0.25 | ||||
| Independent | Louis James Lesosky | 147 | 0.35 | – | ||||
| Total valid votes | 41,534 | 100.0 | ||||||
| Total rejected ballots | 305 | 0.73 | 0.73 | -0.37 | ||||
| Turnout | 41,839 | 58.16 | +2.28 | |||||
| New Democratic hold | Swing | +11.00 | ||||||
| Conservative vote is compared to the total of the Canadian Alliance and Progressive Conservative vote in the 2000 election. | ||||||||
| 2000 Canadian federal election | ||||||||
|---|---|---|---|---|---|---|---|---|
| Party | Candidate | Votes | % | ±% | Expenditures | |||
| New Democratic | Libby Davies | 16,818 | 42.27 | +0.02 | $56,481 | |||
| Liberal | Mason Loh | 13,421 | 33.73 | -3.33 | $58,199 | |||
| Alliance | Sal Vetro | 5,536 | 13.91 | +1.81 | $14,808 | |||
| Progressive Conservative | Michael Walsh | 1,439 | 3.61 | +0.89 | $7,603 | |||
| Green | Kelly Elizabeth White | 975 | 2.45 | -0.99 | $177 | |||
| Marijuana | David Malmo-Levine | 724 | 1.81 | – | ||||
| Canadian Action | Brian Bacon | 432 | 1.08 | – | $2,648 | |||
| Independent | Edna Mathilda Brass | 196 | 0.49 | – | ||||
| Independent | Gloria Anne Kieler | 143 | 0.35 | -0.28 | ||||
| Natural Law | Rosemary F. Galte | 97 | 0.24 | – | ||||
| Total valid votes | 39,781 | 100.0 | ||||||
| Total rejected ballots | 444 | 1.10 | -0.03 | |||||
| Turnout | 40,225 | 55.88 | -4.00 | |||||
| New Democratic hold | Swing | +1.68 | ||||||
| Canadian Alliance vote is compared to the Reform Party vote in the 1997 election. | ||||||||
| 1997 Canadian federal election | ||||||||
|---|---|---|---|---|---|---|---|---|
| Party | Candidate | Votes | % | ±% | Expenditures | |||
| New Democratic | Libby Davies | 14,961 | 42.25 | +11.22 | $52,043 | |||
| Liberal | Anna Terrana | 13,123 | 37.06 | +1.00 | $52,663 | |||
| Reform | Keith Mitchell | 4,287 | 12.10 | +0.16 | $11,525 | |||
| Green | Stuart Parker | 1,221 | 3.44 | +1.99 | $2,871 | |||
| Progressive Conservative | Jerry Cikes | 964 | 2.72 | -6.10 | $5,167 | |||
| Christian Heritage | Gloria Kieler | 226 | 0.63 | – | $844 | |||
| Natural Law | Wayne Melvin | 185 | 0.52 | -0.45 | ||||
| Independent | Kimball Cariou | 161 | 0.45 | -0.41 | $5,097 | |||
| Marxist–Leninist | Charles Boylan | 158 | 0.44 | +0.23 | ||||
| Independent | Ryan Bloc Québécois Bigge | 121 | 0.34 | – | ||||
| Total valid votes | 35,407 | 100.0 | ||||||
| Total rejected ballots | 403 | 1.13 | ||||||
| Turnout | 35,810 | 59.88 | ||||||
| New Democratic gain from Liberal | Swing | +5.11 | ||||||
| 1993 Canadian federal election | ||||||||
|---|---|---|---|---|---|---|---|---|
| Party | Candidate | Votes | % | ±% | ||||
| Liberal | Anna Terrana | 14,357 | 36.06 | +6.29 | ||||
| New Democratic | Margaret Anne Mitchell | 12,357 | 31.03 | -20.17 | ||||
| Reform | Joan Stewart | 4,754 | 11.94 | – | ||||
| Progressive Conservative | Susan Tom | 3,513 | 8.82 | -7.09 | ||||
| National | Bruce Frank Wright | 2,403 | 6.04 | – | ||||
| Libertarian | Wayne Marsden | 811 | 2.04 | +1.33 | ||||
| Green | Kelly Elizabeth White | 579 | 1.45 | +0.43 | ||||
| Natural Law | David Grayson | 386 | 0.97 | – | ||||
| Independent | Kimball Cariou | 343 | 0.86 | – | ||||
| Independent | Will Offley | 103 | 0.26 | – | ||||
| Marxist–Leninist | Brian Sproule | 84 | 0.21 | – | ||||
| Independent | Joe Young | 71 | 0.18 | – | ||||
| Independent | Alan Imrie | 56 | 0.14 | – | ||||
| Total valid votes | 39,817 | 100.0 | ||||||
| Liberal gain from New Democratic | Swing | +13.23 | ||||||
| 1988 Canadian federal election | ||||||||
|---|---|---|---|---|---|---|---|---|
| Party | Candidate | Votes | % | ±% | ||||
| New Democratic | Margaret Anne Mitchell | 20,108 | 51.20 | -0.59 | ||||
| Liberal | Raymond Leung | 11,692 | 29.77 | +4.40 | ||||
| Progressive Conservative | Paul E. Nielsen | 6,248 | 15.91 | -4.32 | ||||
| Green | Robert J. Light | 401 | 1.02 | – | ||||
| Libertarian | Heinz Holzschuher | 278 | 0.71 | -0.22 | ||||
| Rhinoceros | Ruff Tuff Duff Duff Scott | 277 | 0.71 | -0.25 | ||||
| Communist | Kim C. Zander | 180 | 0.46 | -0.27 | ||||
| Independent | Cheryl Stephens Soroka | 88 | 0.22 | – | ||||
| Total valid votes | 39,272 | 100.0 | ||||||
| New Democratic hold | Swing | -2.50 | ||||||
| 1984 Canadian federal election: Vancouver East | ||||||||
|---|---|---|---|---|---|---|---|---|
| Party | Candidate | Votes | % | ±% | ||||
| New Democratic | Margaret Anne Mitchell | 18,464 | 51.79 | +7.88 | ||||
| Liberal | Shirley Maple Wong | 9,044 | 25.37 | -14.64 | ||||
| Progressive Conservative | Jack J. Volrich | 7,210 | 20.22 | +5.61 | ||||
| Rhinoceros | Cameron H. McCabe | 342 | 0.96 | +0.35 | ||||
| Libertarian | Sandy MacDonald | 330 | 0.93 | – | ||||
| Communist | Miguel Figueroa | 259 | 0.73 | +0.17 | ||||
| Total valid votes | 35,649 | 100.0 | ||||||
| New Democratic hold | Swing | +11.26 | ||||||
| 1980 Canadian federal election | ||||||||
|---|---|---|---|---|---|---|---|---|
| Party | Candidate | Votes | % | ±% | ||||
| New Democratic | Margaret Anne Mitchell | 14,245 | 43.91 | +1.21 | ||||
| Liberal | Arthur John "Art" Lee | 12,979 | 40.01 | +0.97 | ||||
| Progressive Conservative | David N. Kilbey | 4,742 | 14.62 | -1.92 | ||||
| Rhinoceros | Dandy Randy Lyttle | 198 | 0.61 | – | ||||
| Communist | J. Fred Wilson | 179 | 0.55 | +0.02 | ||||
| Independent | Paul Tetreault | 61 | 0.19 | – | ||||
| Marxist–Leninist | Chaouac Ferron | 34 | 0.10 | -0.03 | ||||
| Total valid votes | 32,438 | 100.0 | ||||||
| New Democratic hold | Swing | +0.12 | ||||||
| 1979 Canadian federal election | ||||||||
|---|---|---|---|---|---|---|---|---|
| Party | Candidate | Votes | % | ±% | ||||
| New Democratic | Margaret Anne Mitchell | 13,697 | 42.71 | +6.44 | ||||
| Liberal | Arthur John "Art" Lee | 12,522 | 39.04 | +2.57 | ||||
| Progressive Conservative | Cecil H. Leng | 5,304 | 16.54 | -8.91 | ||||
| Social Credit | Carlo Dallavalle | 334 | 1.04 | – | ||||
| Communist | J. Fred Wilson | 170 | 0.53 | -0.59 | ||||
| Marxist–Leninist | Brian K. Sproule | 44 | 0.14 | -0.55 | ||||
| Total valid votes | 32,071 | 100.0 | ||||||
| New Democratic gain from Liberal | Swing | +1.94 | ||||||
| 1974 Canadian federal election | ||||||||
|---|---|---|---|---|---|---|---|---|
| Party | Candidate | Votes | % | ±% | ||||
| Liberal | Arthur J. "Art" Lee | 9,671 | 36.48 | +5.13 | ||||
| New Democratic | C.P. Paddy Neale | 9,614 | 36.26 | -12.55 | ||||
| Progressive Conservative | Hartley Hubbs | 6,747 | 25.45 | +8.91 | ||||
| Communist | Maurice Rush | 298 | 1.12 | +0.38 | ||||
| Marxist–Leninist | Charles Boylan | 181 | 0.68 | – | ||||
| Total valid votes | 26,511 | 100.0 | ||||||
| Liberal gain from New Democratic | Swing | +8.84 | ||||||
| 1972 Canadian federal election | ||||||||
|---|---|---|---|---|---|---|---|---|
| Party | Candidate | Votes | % | ±% | ||||
| New Democratic | C. Paddy Neale | 13,525 | 48.81 | -1.20 | ||||
| Liberal | John Minichiello | 8,687 | 31.35 | -5.21 | ||||
| Progressive Conservative | John G. Balan | 4,584 | 16.54 | +7.63 | ||||
| Social Credit | Walter Stunder | 613 | 2.21 | -0.51 | ||||
| Independent | Maurice Rush | 206 | 0.74 | – | ||||
| Independent | Ian R. Hyman | 92 | 0.33 | – | ||||
| Total valid votes | 27,707 | 100.0 | ||||||
| New Democratic hold | Swing | +2.00 | ||||||
| 1968 Canadian federal election | ||||||||
|---|---|---|---|---|---|---|---|---|
| Party | Candidate | Votes | % | ±% | ||||
| New Democratic | Harold Edward Winch | 13,339 | 50.02 | -6.87 | ||||
| Liberal | Robert Kennedy | 9,750 | 36.56 | +17.51 | ||||
| Progressive Conservative | Max E. Meyer | 2,377 | 8.91 | -0.21 | ||||
| Social Credit | P. Daniel Emanuele | 726 | 2.72 | -10.91 | ||||
| Communist | Charles Caron | 477 | 1.79 | – | ||||
| Total valid votes | 26,669 | 100.0 | ||||||
| New Democratic hold | Swing | -12.19 | ||||||
| 1965 Canadian federal election | ||||||||
|---|---|---|---|---|---|---|---|---|
| Party | Candidate | Votes | % | ±% | ||||
| New Democratic | Harold Edward Winch | 11,854 | 56.89 | +2.59 | ||||
| Liberal | Alexander C. Sharp | 3,969 | 19.05 | -4.65 | ||||
| Social Credit | Walter W. Campbell | 2,840 | 13.63 | +5.91 | ||||
| Progressive Conservative | Gladys Chong | 1,900 | 9.12 | -5.16 | ||||
| Progressive Workers | Jerry Le Bourdais | 274 | 1.31 | – | ||||
| Total valid votes | 20,837 | 100.0 | ||||||
| New Democratic hold | Swing | +3.62 | ||||||
| 1963 Canadian federal election | ||||||||
|---|---|---|---|---|---|---|---|---|
| Party | Candidate | Votes | % | ±% | ||||
| New Democratic | Harold Edward Winch | 12,688 | 54.30 | -0.04 | ||||
| Liberal | Alexander Charles Sharp | 5,538 | 23.70 | +4.10 | ||||
| Progressive Conservative | Gladys Guy Chong | 3,335 | 14.27 | -0.69 | ||||
| Social Credit | Dorothy Jean Munnik | 1,804 | 7.72 | -0.51 | ||||
| Total valid votes | 23,365 | 100.0 | ||||||
| New Democratic hold | Swing | -2.07 | ||||||
| 1962 Canadian federal election | ||||||||
|---|---|---|---|---|---|---|---|---|
| Party | Candidate | Votes | % | ±% | ||||
| New Democratic | Harold Edward Winch | 12,329 | 54.35 | +5.79 | ||||
| Liberal | Marino Culos | 4,447 | 19.60 | +10.41 | ||||
| Progressive Conservative | Oris Kirk | 3,395 | 14.97 | -21.62 | ||||
| Social Credit | Michael John McCann | 1,867 | 8.23 | +2.57 | ||||
| Communist | Thomas Alexander McEwen | 648 | 2.86 | – | ||||
| Total valid votes | 22,686 | 100.0 | ||||||
| New Democratic hold | Swing | -2.31 | ||||||
| New Democrat vote is compared to the Co-operative Commonwealth vote in the 1958 election. | ||||||||
| 1958 Canadian federal election | ||||||||
|---|---|---|---|---|---|---|---|---|
| Party | Candidate | Votes | % | ±% | ||||
| Co-operative Commonwealth | Harold Edward Winch | 11,486 | 48.56 | +0.97 | ||||
| Progressive Conservative | Norman Mullins | 8,654 | 36.59 | +18.45 | ||||
| Liberal | Alexander Charles Sharp | 2,175 | 9.20 | -1.64 | ||||
| Social Credit | Michael John McCann | 1,338 | 5.66 | -17.79 | ||||
| Total valid votes | 23,653 | 100.0 | ||||||
| Co-operative Commonwealth hold | Swing | -8.74 | ||||||
| 1957 Canadian federal election | ||||||||
|---|---|---|---|---|---|---|---|---|
| Party | Candidate | Votes | % | ±% | ||||
| Co-operative Commonwealth | Harold Edward Winch | 10,782 | 47.59 | -2.99 | ||||
| Social Credit | John Chmelyk | 5,312 | 23.44 | -0.80 | ||||
| Progressive Conservative | Norman Douglas Mullins | 4,110 | 18.14 | +12.99 | ||||
| Liberal | Alexander Charles Sharp | 2,454 | 10.83 | -5.41 | ||||
| Total valid votes | 22,658 | 100.0 | ||||||
| Co-operative Commonwealth hold | Swing | -1.10 | ||||||
| 1953 Canadian federal election | ||||||||
|---|---|---|---|---|---|---|---|---|
| Party | Candidate | Votes | % | ±% | ||||
| Co-operative Commonwealth | Harold Edward Winch | 10,192 | 50.58 | +3.49 | ||||
| Social Credit | Raymond McCarthy | 4,885 | 24.24 | – | ||||
| Liberal | William Reid | 3,272 | 16.24 | -17.78 | ||||
| Progressive Conservative | Benjamin A.R. Morley | 1,038 | 5.15 | -9.12 | ||||
| Labor–Progressive | Maurice Rush | 764 | 3.79 | -0.82 | ||||
| Total valid votes | 20,151 | 100.0 | ||||||
| Co-operative Commonwealth hold | Swing | -10.38 | ||||||
| 1949 Canadian federal election | ||||||||
|---|---|---|---|---|---|---|---|---|
| Party | Candidate | Votes | % | ±% | ||||
| Co-operative Commonwealth | Angus MacInnis | 14,056 | 47.09 | +2.40 | ||||
| Liberal | William Reid | 10,154 | 34.02 | +12.28 | ||||
| Progressive Conservative | Joseph Friend Day | 4,261 | 14.28 | -5.29 | ||||
| Labor–Progressive | Charles McGregor Stewart | 1,377 | 4.61 | -7.35 | ||||
| Total valid votes | – | 100.0 | ||||||
| Co-operative Commonwealth hold | Swing | -4.94 | ||||||
| 1945 Canadian federal election | ||||||||
|---|---|---|---|---|---|---|---|---|
| Party | Candidate | Votes | % | ±% | ||||
| Co-operative Commonwealth | Angus MacInnis | 16,003 | 44.69 | +1.71 | ||||
| Liberal | William Reid | 7,786 | 21.74 | -9.90 | ||||
| Progressive Conservative | William Ward | 7,008 | 19.57 | – | ||||
| Labor–Progressive | Harold James Pritchett | 4,283 | 11.96 | +7.15 | ||||
| Democratic | William Nicholas Wallace | 729 | 2.04 | |||||
| Total valid votes | 35,809 | 100.0 | ||||||
| Co-operative Commonwealth hold | Swing | +5.80 | ||||||
| Labour-Progressive vote is compared to the Communist vote in the 1940 election. | ||||||||
| 1940 Canadian federal election | ||||||||
|---|---|---|---|---|---|---|---|---|
| Party | Candidate | Votes | % | ±% | ||||
| Co-operative Commonwealth | Angus MacInnis | 12,490 | 42.98 | -7.93 | ||||
| Liberal | John Henderson | 9,196 | 31.65 | +5.16 | ||||
| New Democracy | William Wilfred Derpak | 5,975 | 20.56 | – | ||||
| Communist | Fergus McKean | 1,398 | 4.81 | -1.00 | ||||
| Total valid votes | 29,059 | 100.0 | ||||||
| Co-operative Commonwealth hold | Swing | -6.54 | ||||||
| 1935 Canadian federal election | ||||||||
|---|---|---|---|---|---|---|---|---|
| Party | Candidate | Votes | % | |||||
| Co-operative Commonwealth | Angus MacInnis | 13,629 | 50.91 | |||||
| Liberal | J. Lorne MacDougall | 7,090 | 26.48 | |||||
| Conservative | Thomas Todrick | 3,364 | 12.57 | |||||
| Communist | Malcolm Bruce | 1,555 | 5.81 | |||||
| Reconstruction | Clifford Norman Borton | 1,134 | 4.24 | |||||
| Total valid votes | 26,772 | 100.0 | ||||||
| This riding was created from Vancouver South and Vancouver—Burrard, which elected an Independent Labour and a Liberal, respectively, in the previous election. Angus MacInnis was the Independent Labour incumbent from Vancouver South. | ||||||||
See also edit
References edit
- "Vancouver East (federal electoral district) (Code 59030) Census Profile". 2011 census. Government of Canada - Statistics Canada. Retrieved March 6, 2011.
Notes edit
- ^ Statistic includes all persons that did not make up part of a visible minority or an indigenous identity.
- ^ Statistic includes total responses of "Chinese", "Korean", and "Japanese" under visible minority section on census.
- ^ Statistic includes total responses of "Filipino" and "Southeast Asian" under visible minority section on census.
- ^ Statistic includes total responses of "West Asian" and "Arab" under visible minority section on census.
- ^ Statistic includes total responses of "Visible minority, n.i.e." and "Multiple visible minorities" under visible minority section on census.
- ^ a b "Population and dwelling counts: Canada and federal electoral districts (2013 Representation Order)". Statistics Canada. Government of Canada. February 9, 2022. Retrieved April 6, 2022.
- ^ Vancouver East, CBC.ca, 2008.
- ^ National Household Survey (NHS), January 15, 2001
- ^ Government of Canada, Statistics Canada (October 26, 2022). "Census Profile, 2021 Census of Population". www12.statcan.gc.ca. Retrieved February 16, 2023.
- ^ Government of Canada, Statistics Canada (October 27, 2021). "Census Profile, 2016 Census". www12.statcan.gc.ca. Retrieved February 16, 2023.
- ^ Government of Canada, Statistics Canada (November 27, 2015). "NHS Profile". www12.statcan.gc.ca. Retrieved February 16, 2023.
- ^ "Confirmed candidates — Vancouver East". Elections Canada. September 1, 2021. Retrieved September 6, 2021.
- ^ "List of confirmed candidates". Elections Canada. Retrieved October 4, 2019.
- ^ "Election Night Results". Elections Canada. Retrieved November 15, 2019.
- ^ Elections Canada – Confirmed candidates for Vancouver East, 30 September 2015
- ^ Elections Canada – Preliminary Election Expenses Limits for Candidates
- ^ "Résultats du soir d'élection – Circonscriptions".