TRANSIMS (TRansportation ANalysis SIMulation System) is an integrated set of tools developed to conduct regional transportation system analyses. With the goal of establishing TRANSIMS as an ongoing public resource available to the transportation community, TRANSIMS is made available under the NASA Open Source Agreement Version 1.3
Background edit
TRANSIMS is an integrated set of tools to conduct regional transportation system analyses based on a cellular automata microsimulator. It uses a new paradigm of modeling individual travelers and their multi-modal transportation based on synthetic populations and their activities. Compared to other transportation aggregate models, TRANSIMS represents time consistently and continuously, as well as detailed persons and households. Its time-dependent routing and person-based microsimulator also differ from other aggregate models.
Methodology edit
Overview edit
The goal of the methodology is to load traffic onto the network and iterate towards the Nash equilibrium. Submodules include population synthesizer, activity generator, route planner and microsimulator. Feedback from modules will be next input as the equilibration process iterates. Travelers are modeled to achieve a shorter path that is best for the overall population instead of a significantly better route. One important constraint is that travelers choose a transportation mode according to travel surveys rather than to optimize their travel needs.
-
 Basic TRANSIMS Methodology

Input data edit
TRANSIMS creates a road network, a transit network, as well as transit schedules in this step. Usually, street and transit networks are available from metropolitan planning organizations. Networks can be exported from other traffic analysis tools into a fairly simple tabular format to be input into TRANSIMS. Several features are imbedded in TRANSIMS to edit networks. It can make use of some common GIS tools and formats (shapefiles) with regards to network editing and visualization. It can also understand important geographic information systems, such as state plane system, universal transverse mercator system, etc. There are challenges for network data. Street network is usually available through public Census Tiger/Line, commercial NavTeq, and especially networks prepared and maintained by MPOs. However, many details that are not typically provided by common data sources are needed, such as traffic signals, turn lanes, etc. In addition, street network must be topologically appropriate, that is, connections between links must be consistent and representative. Transit network must be compatible with the street network layer. Data usually must be compiled from several independent sources. Buses are flowing with the traffic, therefore results may conflict with original bus schedules.
Population synthesizer edit
This step is to mimic regional population to ensure that demographics closely match real population, and that households distribution spatially approximates that of regional population. Detailed functions of the population synthesize include the generation of synthetic households from the census block group data, development of each household demographic characteristics (income, members, etc.), placement of each synthetic household on a link in transportation network (activity locations), and assignment of vehicles to each household (sharing vehicles and rides within a household).[1][2] Two types of data are applicable in this step. STF3 data is aggregate data describing relatively small regions named block groups, and PUMS is disaggregate data covering a much larger area and reduced to a 5% sample.[3][4]
One challenge for this step is the extrapolation of census data may not be accurate. Furthermore, additional land use data is necessary to allocate households appropriately to activity locations.
-
 Population Synthesizer Input&Output

Activity generator edit
This step is to generate household activities, activity priorities, activity locations, activity times, and mode and travel preferences. This step requires additional data input to assign individual activities. The main input data is a detailed activity survey that is representative. General activity assignment process is to match synthetic households with corresponding survey households based on socioeconomic data collected. In addition, small random variations are applied to survey records to avoid exact duplications for the many different synthetic households. Based on the input demographics, a list of travel activities will be produced for each household. These activities will be designated as "household" or "individual" activities. Associated with each activity is a set of parameters defining the activity importance, the activity duration, and a time interval during which the activity must be performed, if it is performed at all (for example, work is mandatory, so a work trip must be made, but a shopping trip is typically not as important and may be skipped on a given day if the scheduling is too difficult). Locations, such as the household address and the workplace and school addresses, will be provided for mandatory activities. Locations of other activities (shopping) are not specified- the planner will choose these from a list for the locality.[5] Mode preference is also modeled based on survey records rather than route optimization.
There are several challenges for the activity generator. Limited sample size in the survey may create a coarse activity assignment. It highly depends on the availability of a recent and up-to-date activity survey, as well as detailed zoning information requiring manual adjustments. Last, it may generate some illogical activity patterns for certain regions.
Route planner edit
This step is to read individual activities previously generated, then determine the fastest route at that time of the day. The route planner has several features. Households are routed in a coordinated fashion to allow for ride sharing. The algorithm includes time-dependent optimization of the network based on link delays that vary during the day. The router does not choose the transportation mode but finds the best route given the mode. The router starts by using well-known traffic assignment function BPR+ to estimate link delays based on the number of trips routed through each link.[6] It then determines the optimal route for each trip and creates precise trip plans. A trip plan is a sequence of modes, routes, and planned departure and arrival times at the origin and destinations, and mode changing facilities projected to move individuals to activity locations.[7]
-
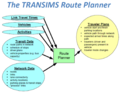 Route Planner Input&Output

Microsimulator edit
This step is to execute all travel plans created by the router on a second by second basis throughout the network. It uses Cellular Automata principles to analyze the interaction between individual vehicles. The microsimulator produces individual locations of all travelers and vehicles at all times. The microsimulator and the router work in an iterative loop to equilibrate the assigned traffic in the network. The microsimulator follows those travel plans and determines a new set of link delays that are used to replace the ones previously used by the router. This process iterate until equilibrium is achieved.
-
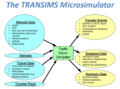 Microsimulator Input&Output

Feedback edit
Feedback is applied to the equilibration process iterating between router and microsimulator. Through feedback module, some routes may be found infeasible. These activities are then passed back to the activity generator to determine appropriate alternatives. Some trip plans cannot be followed in the microsimulator because of time-dependent road closures and other triggers. In this case, individuals with those plans are passed back to the router for new routing suggestions.
Results edit
TRANSIMS can create aggregate results comparable to traditional analysis tools. The microsimulation can lead to highly detailed snapshot data, for example, the exact location of every traveler at any given time. Since the amount of data is difficult to comprehend, the results need to be effectively visualized. Visualization tools that are commonly used include the original TRANSIMS visualizer, fourDscape and the Balfour (software) visualizer, ArcGIS and similar GIS tools, Google Earth and NASA World Wind, Advanced Visualization (NCSA), and NEXTA.
Applications edit
There has been much discussion in the transportation profession concerning how widely adopted TRANSIMS will be, producing several schools of thought. Skeptics believe the large data requirements, computer requirements, and training requirements will limit use of TRANSIMS to a handful of the largest MPOs. A second school of thought is that regulatory requirements will quickly force the use of TRANSIMS in many regions. This accelerated adoption of TRANSIMS might exceed the capability of project staff to support the affected regions. A final school of thought is that in the beginning, TRANSIMS will indeed be used mainly by larger MPOs with particularly sophisticated transportation planning questions. Subsequently, TRANSIMS would evolve into versions which would be more appropriate for MPOs with smaller staffs and different analysis needs. Experience with the earlier software suggests that this last scenario is most likely. It is also the most promising scenario for bringing new technology to the broadest audience in a less painful manner.[8]
Dallas case study edit
The Dallas case focused on development of a microsimulation in TRANSIMS which would be robust enough to execute the travel itinerary of each individual in an urban region. The microsimulation developed was limited to automobile trips, and methods were developed to use existing NCTCOG’s zonal production/attraction information as the source of traveler demand on the system. The microsimulation executed approximately 200,000 trips (between 5:00 A.M. and 10:00 A.M.) in and through the 25-square-mile (65 km2) study area. It ran in real time on five SUN SPARC workstations (“real time” meaning a five-hour period took five hours).[8]
Portland case study edit
In contrast to the “real world” planning question explored in Dallas, the Portland case study explored the effects of different types of data on the results and sensitivity of TRANSIMS. The route planner and microsimulation capability developed for Dallas was expanded to include large vehicles, transit vehicles, and transit passengers. This includes the complicated tasks of incorporating into the data base all transit vehicle schedules, the different operating characteristics of rail and buses, and simulating the interaction of transit vehicles and private vehicles. Two sensitivity tests were under consideration. The first tested the effect of generating synthetic local streets instead of realistically coding every single street in the region. The second test explored the effect of synthesizing traffic signal plans. To test these and other model sensitivities, the Portland staff assembled the actual local street and traffic signal plans to compare with the results of the synthesis.[8] These tests determined the effect of the data synthesis on the sensitivity of the TRANSIMS models.
References edit
- https://code.google.com/p/transims/
- https://web.archive.org/web/20120415123916/http://tmiponline.org/Clearinghouse/Subject-Category/TRANSIMS.aspx
- ^ Guin, Angshuman., Introduction to TRANSIMS, March 2010, https://t-square.gatech.edu/access/content/group/28974.201002/Introduction_to_TRANSIMS_Part1.pdf
- ^ Beckman, Richard J.; Baggerly, Keith A.; McKay, Michael D., Creating Synthetic Baseline Populations, http://tmip.fhwa.dot.gov/resources/clearinghouse/docs/transims_series/csbp.pdf
- ^ Guin, Angshuman., Introduction to TRANSIMS, March 2010, https://t-square.gatech.edu/access/content/group/28974.201002/Introduction_to_TRANSIMS_Part1.pdf
- ^ Smith, LaRon; Beckman, Richard; Baggerly, Keith; Anson, Doug; Williams, Michael., TRANSIMS: TRansportation ANalysis and SIMulation System: Project Summary and Status, 1995, http://ntl.bts.gov/DOCS/466.html
- ^ Smith, LaRon; Beckman, Richard; Baggerly, Keith; Anson, Doug; Williams, Michael., TRANSIMS: TRansportation ANalysis and SIMulation System: Project Summary and Status, 1995, http://ntl.bts.gov/DOCS/466.html
- ^ Guin, Angshuman., Introduction to TRANSIMS, March 2010, https://t-square.gatech.edu/access/content/group/28974.201002/Introduction_to_TRANSIMS_Part1.pdf
- ^ Smith, LaRon; Beckman, Richard; Baggerly, Keith; Anson, Doug; Williams, Michael., TRANSIMS: TRansportation ANalysis and SIMulation System: Project Summary and Status, 1995, http://ntl.bts.gov/DOCS/466.html
- ^ a b c "Early Deployment of TRANSIMS: Issue Paper" (PDF). Arlington, Texas. August 1999. Archived from the original (PDF) on May 27, 2010. Retrieved 2023-05-26.
Travel Model Improvement Program