The 5th local elections were held in South Korea on 2 June 2010.[1] The voter turnout reached 54.4%, the highest in 15 years.[2]
| |||||||||||||||||||||||||||||||||||||||||
All 16 seats of Metropolitan Mayors and Governors (All 3,991 seats of Provincial and Municipal leaders and Assemblies) | |||||||||||||||||||||||||||||||||||||||||
|---|---|---|---|---|---|---|---|---|---|---|---|---|---|---|---|---|---|---|---|---|---|---|---|---|---|---|---|---|---|---|---|---|---|---|---|---|---|---|---|---|---|
| |||||||||||||||||||||||||||||||||||||||||
.svg) Left top: Results of metropolitan mayoral and gubernatorial elections Right top: Results of municipal mayoral elections Left bottom: Results of provincial legislative elections Right top: Results of municipal legislative elections GNP DP LFP DLP CKP NPP PFU PPP FU PPU Ind. | |||||||||||||||||||||||||||||||||||||||||


_(cropped).jpg)

Voter turnout by region edit
| Region | Electorate | Turnout | % |
|---|---|---|---|
| Seoul | 8,211,461 | 4,421,491 | 53.8 |
| Busan | 2,849,895 | 1,410,809 | 49.5 |
| Daegu | 1,928,835 | 886,317 | 45.9 |
| Incheon | 2,096,853 | 1,068,735 | 50.9 |
| Gwangju | 1,064,913 | 530,688 | 49.8 |
| Daejeon | 1,127,547 | 595,718 | 52.9 |
| Ulsan | 838,805 | 462,339 | 55.1 |
| Gyeonggi | 8,761,840 | 4,538,591 | 51.8 |
| Gangwon | 1,190,509 | 742,105 | 62.3 |
| North Chungcheong | 1,183,811 | 695,977 | 58.8 |
| South Chungcheong | 1,595,587 | 902,299 | 56.5 |
| North Jeolla | 1,442,805 | 856,846 | 59.3 |
| South Jeolla | 1,504,902 | 967,573 | 64.3 |
| North Gyeongsang | 2,122,905 | 1,260,726 | 59.4 |
| South Gyeongsang | 2,506,393 | 1,550,538 | 61.8 |
| Jeju | 424,098 | 276,134 | 65.1 |
| Total | 38,851,159 | 21,166,886 | 54.5 |
| Source:투표진행상황 | |||
Provincial-level elections edit
The ruling GNP was able to win 4 out of 7 mayoral seats but suffer by massive landslide on the gubernatorial election winning only 2 out of 9 seats. On the other hand, DP was able to capture 2 mayoral seats and swept 5 out of 9 gubernatorial seats. The LFP won Daejeon while two independent candidates won gubernatorial seats in South Gyeongsang Province and the other in Jeju Province.
Metropolitan city mayors edit
| City | Incumbent | Party | First elected |
Result | Candidates | ||
|---|---|---|---|---|---|---|---|
| Seoul | Oh Se-hoon | GNP | 2006 | Incumbent re-elected. |
| ||
| Gwangju | Park Gwang-tae | DP | 2002 | Incumbent retired. New mayor elected. DP hold. |
| ||
| Daegu | Kim Bum-il | GNP | 2006 | Incumbent re-elected. |
| ||
| Daejeon | Park Sung-hyo | GNP | 2006 | Incumbent lost. New mayor elected. LFP gain. |
| ||
| Busan | Hur Nam-sik | GNP | 2004 | Incumbent re-elected. |
| ||
| Ulsan | Park Maeng-woo | GNP | 2002 | Incumbent re-elected. |
| ||
| Incheon | Ahn Sang-soo | GNP | 2002 | Incumbent lost. New mayor elected. DP gain. |
| ||
Provincial governors edit
| Province | Incumbent | Party | First elected |
Result | Candidates | ||
|---|---|---|---|---|---|---|---|
| Gangwon | Kim Jin-sun | GNP | 1998 | Incumbent retired. New governor elected. DP gain. |
| ||
| Gyeonggi | Kim Moon-soo | GNP | 2006 | Incumbent re-elected. |
| ||
| North Gyeongsang | Kim Kwan-yong | GNP | 2006 | Incumbent re-elected. |
| ||
| South Gyeongsang | Kim Tae-ho | GNP | 2004 | Incumbent retired. New governor elected. Independent gain. |
| ||
| North Jeolla | Kim Wan-ju | DP | 2006 | Incumbent re-elected. |
| ||
| South Jeolla | Park Jun-young | DP | 2004 | Incumbent re-elected. |
| ||
| North Chungcheong | Chung Woo-taik | GNP | 2006 | Incumbent lost. New governor elected. DP gain. |
| ||
| South Chungcheong | Lee In-hwa | Independent | Acting | Governor Lee Wan-koo resigned December 4, 2009. New governor elected. DP gain. |
| ||
| Jeju | Kim Tae-hwan | Independent | 2006 | Incumbent retired. New governor elected. Independent gain. |
| ||
-
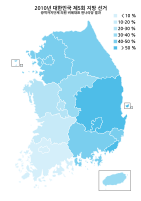
 Provincial Governor election turnout rates
 -
 Metropolitan Mayoral and Governor election map by party
.svg)
.svg)
Provincial-level councilors edit
Summary edit
| Party | Constituency | Proportional | Total seats | +/– | |||||
|---|---|---|---|---|---|---|---|---|---|
| Votes | % | Seats | Votes | % | Seats | ||||
| Democratic Party | 6,849,717 | 35.08 | 328 | 7,252,190 | 35.10 | 32 | 360 | +228 | |
| Grand National Party | 7,755,547 | 39.72 | 252 | 8,229,971 | 39.83 | 36 | 288 | –269 | |
| Liberty Forward Party | 681,024 | 3.49 | 38 | 936,957 | 4.53 | 3 | 41 | New | |
| Democratic Labor Party | 653,715 | 3.35 | 18 | 1,519,364 | 7.35 | 6 | 24 | +9 | |
| Participation Party | 364,093 | 1.86 | 3 | 1,374,951 | 6.65 | 2 | 5 | New | |
| New Progressive Party | 185,380 | 0.95 | 3 | 647,346 | 3.13 | 0 | 3 | New | |
| Future Hope Alliance | 123,379 | 0.63 | 1 | 379,737 | 1.84 | 2 | 3 | New | |
| Party of Future Union | 183,385 | 0.94 | 1 | 159,503 | 0.77 | 0 | 1 | New | |
| Other parties | 86,835 | 0.44 | 0 | 164,349 | 0.80 | 0 | 0 | – | |
| Independents | 2,644,102 | 13.54 | 36 | 36 | +22 | ||||
| Total | 19,527,177 | 100.00 | 680 | 20,664,368 | 100.00 | 81 | 761 | +28 | |
Constituency seats edit
| Region | Seats | DP | GNP | LFP | DLP | PPP | NPP | FHA | FU | Ind. |
|---|---|---|---|---|---|---|---|---|---|---|
| Seoul | 96 | 74 | 22 | |||||||
| Busan | 42 | 37 | 5 | |||||||
| Daegu | 26 | 25 | 1 | |||||||
| Incheon | 30 | 21 | 5 | 1 | 1 | 2 | ||||
| Gwangju | 19 | 18 | 1 | |||||||
| Daejeon | 19 | 4 | 15 | |||||||
| Ulsan | 19 | 11 | 6 | 2 | ||||||
| Gyeonggi | 112 | 71 | 36 | 1 | 1 | 1 | 2 | |||
| Gangwon | 38 | 12 | 20 | 6 | ||||||
| North Chungcheong | 28 | 20 | 3 | 4 | 1 | |||||
| South Chungcheong | 36 | 12 | 5 | 19 | ||||||
| North Jeolla | 34 | 33 | 1 | |||||||
| South Jeolla | 51 | 45 | 2 | 4 | ||||||
| North Gyeongsang | 52 | 44 | 1 | 1 | 6 | |||||
| South Gyeongsang | 49 | 2 | 35 | 4 | 1 | 2 | 5 | |||
| Jeju | 29 | 16 | 9 | 1 | 3 | |||||
| Total | 680 | 328 | 252 | 38 | 18 | 3 | 3 | 1 | 1 | 36 |
Proportional representation seats edit
| Region | Seats | GNP | DP | DLP | LFP | PPP | PPC |
|---|---|---|---|---|---|---|---|
| Seoul | 10 | 5 | 5 | ||||
| Busan | 5 | 3 | 2 | ||||
| Daegu | 3 | 2 | 1 | ||||
| Incheon | 3 | 1 | 2 | ||||
| Gwangju | 3 | 2 | 1 | ||||
| Daejeon | 3 | 1 | 1 | 1 | |||
| Ulsan | 3 | 2 | 1 | ||||
| Gyeonggi | 12 | 6 | 5 | 1 | |||
| Gangwon | 4 | 2 | 2 | ||||
| North Chungcheong | 3 | 1 | 2 | ||||
| South Chungcheong | 4 | 1 | 1 | 2 | |||
| North Jeolla | 4 | 1 | 2 | 1 | |||
| South Jeolla | 6 | 1 | 4 | 1 | |||
| North Gyeongsang | 6 | 4 | 1 | 1 | |||
| South Gyeongsang | 5 | 3 | 1 | 1 | |||
| Jeju | 7 | 3 | 2 | 1 | 1 | ||
| Total | 81 | 36 | 32 | 6 | 3 | 2 | 2 |
-
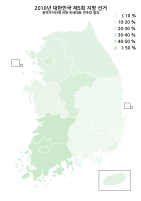
 GNP Winning Margins on PR seats for provincial legislative elections
 -
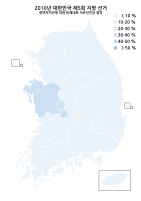
 DEP Winning Margins on PR seats for provincial legislative elections
 -
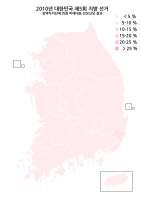
 LFP Winning Margins on PR seats for provincial legislative elections
 -
 DLP Winning Margins on PR seats for provincial legislative elections
 -
 NPP Winning Margins on PR seats for provincial legislative elections
 -
 PPP Winning Margins on PR seats for provincial legislative elections
.svg)
.svg)
.svg)
.svg)
.svg)
.svg)
Municipal-level elections edit
..svg)
■ GNP ■ DEP ■ LFP ■ DLP ■ PFU ■ FU ■ Ind.
Municipal-level mayors edit
Summary edit
| Party | Seats | +/– | |
|---|---|---|---|
| Democratic Party | 92 | +53 | |
| Grand National Party | 82 | –73 | |
| Liberty Forward Party | 13 | New | |
| Democratic Labor Party | 3 | +3 | |
| People's First Union | 1 | New | |
| Party of Future Union | 1 | New | |
| Independent | 36 | +7 | |
| Total | 228 | –2 | |
By region edit
| Region | Mayors | DP | GNP | LFP | DLP | PFU | FU | Ind. |
|---|---|---|---|---|---|---|---|---|
| Seoul | 25 | 21 | 4 | |||||
| Busan | 16 | 13 | 3 | |||||
| Daegu | 8 | 6 | 2 | |||||
| Incheon | 10 | 6 | 1 | 2 | 1 | |||
| Gwangju | 5 | 4 | 1 | |||||
| Daejeon | 5 | 1 | 1 | 3 | ||||
| Ulsan | 5 | 3 | 1 | 1 | ||||
| Gyeonggi | 31 | 19 | 10 | 2 | ||||
| Gangwon | 18 | 4 | 10 | 4 | ||||
| North Chungcheong | 23 | 16 | 1 | 6 | ||||
| South Chungcheong | 18 | 1 | 11 | 6 | ||||
| North Jeolla | 14 | 13 | 1 | |||||
| South Jeolla | 22 | 15 | 7 | |||||
| North Gyeongsang | 12 | 5 | 3 | 3 | 1 | |||
| South Gyeongsang | 16 | 3 | 4 | 7 | 1 | 1 | ||
| Total | 228 | 92 | 82 | 13 | 3 | 1 | 1 | 36 |
Municipal-level councilors edit
Summary edit
| Party | Seats | |||||
|---|---|---|---|---|---|---|
| Constituency | Proportional | Total | +/– | |||
| Grand National Party | 1087 | 160 | 1247 | –375 | ||
| Democratic Party | 871 | 154 | 1025 | +120 | ||
| Liberty Forward Party | 95 | 22 | 117 | New | ||
| Democratic Labor Party | 90 | 25 | 115 | +49 | ||
| Participation Party | 17 | 7 | 24 | New | ||
| New Progressive Party | 22 | 0 | 22 | New | ||
| Future Hope Alliance | 12 | 7 | 19 | New | ||
| Party of Future Union | 10 | 1 | 11 | New | ||
| People's First Union | 2 | 0 | 2 | New | ||
| Creative Korea Party | 1 | 0 | 1 | New | ||
| Independent | 305 | – | 305 | +77 | ||
| Total | 2512 | 376 | 2888 | – | ||
| Source: 구·시·군의회의원선거 정당별 당선인수기초의원비례대표선거 정당별 당선인수 | ||||||
Constituency seats edit
| Region | Seats | GNP | DP | LFP | DLP | NPP | PPP | PPC | FU | PFU | CKP | Ind. |
|---|---|---|---|---|---|---|---|---|---|---|---|---|
| Seoul | 366 | 183 | 173 | 3 | 4 | 2 | 1 | |||||
| Busan | 158 | 93 | 28 | 9 | 3 | 2 | 2 | 1 | 20 | |||
| Daegu | 102 | 70 | 4 | 2 | 2 | 1 | 5 | 3 | 15 | |||
| Incheon | 97 | 46 | 43 | 4 | 2 | 2 | ||||||
| Gwangju | 59 | 44 | 10 | 2 | 3 | |||||||
| Daejeon | 55 | 11 | 21 | 23 | ||||||||
| Ulsan | 43 | 25 | 13 | 2 | 1 | 2 | ||||||
| Gyeonggi | 363 | 177 | 165 | 8 | 2 | 2 | 1 | 1 | 7 | |||
| Gangwon | 146 | 90 | 36 | 20 | ||||||||
| North Chungcheong | 114 | 44 | 45 | 12 | 2 | 11 | ||||||
| South Chungcheong | 152 | 50 | 34 | 60 | 2 | 6 | ||||||
| North Jeolla | 173 | 119 | 3 | 1 | 4 | 46 | ||||||
| South Jeolla | 211 | 146 | 14 | 2 | 49 | |||||||
| North Gyeongsang | 247 | 162 | 1 | 2 | 2 | 1 | 5 | 2 | 72 | |||
| South Gyeongsang | 226 | 136 | 12 | 20 | 4 | 3 | 51 | |||||
| Total | 2,512 | 1,087 | 871 | 95 | 90 | 22 | 17 | 12 | 10 | 2 | 1 | 305 |
References edit
- ^ Foundation, The Korea International Broadcasting. "한국을 대표하는 글로벌 방송! The World On Arirang!". June 2 Local Elections Voter Turnout : ARIRANG.
- ^ [6·2 국민의 선택] 투표율 54.5%… 15년만에 최고, 조선일보
External links edit
- 5th local elections results - the Central Election Management Committee