San Pascual, officially the Municipality of San Pascual (Tagalog: Bayan ng San Pascual), is a 1st class municipality in the province of Batangas, Philippines. According to the 2020 census, it has a population of 69,009 making it as the 9th most populous municipality in the province.
San Pascual | |
|---|---|
| Municipality of San Pascual | |
From top to bottom: San Pascual Municipal Hall, Downtown San Pascual, San Pascual Baylon Parish Church | |
 Flag  Seal | |
| Motto(s): "San Pascual, Bayan Nating Mahal" "San Pascual, Bayang Marangal" | |
 Map of Batangas with San Pascual highlighted | |
OpenStreetMap  | |
.svg) San Pascual Location within the Philippines | |
| Coordinates: 13°48′N 121°02′E / 13.8°N 121.03°E | |
| Country | Philippines |
| Region | Calabarzon |
| Province | Batangas |
| District | 2nd district |
| Founded | August 4, 1969 |
| Named for | St. Paschal Baylón |
| Barangays | 29 (see Barangays) |
| Government | |
| • Type | Sangguniang Bayan |
| • Mayor | Antonio A. Dimayuga |
| • Vice Mayor | Angelina D. Castillo |
| • Representative | Gerville Luistro |
| • Municipal Council | Members |
| • Electorate | 41,762 voters (2022) |
| Area | |
| • Total | 50.70 km2 (19.58 sq mi) |
| Elevation | 46 m (151 ft) |
| Highest elevation | 155 m (509 ft) |
| Lowest elevation | 0 m (0 ft) |
| Population (2020 census)[3] | |
| • Total | 69,009 |
| • Density | 1,400/km2 (3,500/sq mi) |
| • Households | 17,717 |
| Economy | |
| • Income class | 1st municipal income class |
| • Poverty incidence | 7.53 |
| • Revenue | ₱ 308.9 million (2020) |
| • Assets | ₱ 863.9 million (2020) |
| • Expenditure | ₱ 238.2 million (2020) |
| • Liabilities | ₱ 85.09 million (2020) |
| Service provider | |
| • Electricity | Manila Electric Company (Meralco) |
| Time zone | UTC+8 (PST) |
| ZIP code | 4204 |
| PSGC | |
| IDD : area code | +63 (0)43 |
| Native languages | Tagalog |
| Major religions | Christianity |
| Patron saint | St. Paschal Baylón |


The municipality borders Bauan on the west, Alitagtag and San Jose on the north, and Batangas City on the east.
History edit

Separation from Bauan edit
Historically, San Pascual was a part of Bauan and was originally referred to as "Lagnas." The name "Lagnas", which refers to the municipality's location physically between the Lagnas and Hagonoy Rivers, is derived from the local dialect and means "river boundaries."
San Pascual became a separate municipality in 1969 by virtue of Republic Act No. 6116. It initially consisted of 25 barrios, all carved out from Bauan, namely: San Pascual, Danglayan, San Antonio, Laurel, Bayanan, San Mateo, Banaba, Natunuan North, Natunuan South, Kaing-in, Santo Niño, Sambat, Palsahingin, Alalum, Santa Elena, Del Pilar, Malaking Pook, Pila, San Mariano, Pook ni Banal, Pook ng Kapitan, Mataas na Lupa, Ilat, Gelerang Cawayan (Gelerang Kawayan), and Resplando.[5]
Religious attributions edit
The religious populace and congregation therefore changed the name of the Lagnas neighborhood to San Pascual De Baylon in honor of the Roman Catholic saint. It was thought that naming a location after one of its patron saints would bring luck and a prosperous future. As a result, somewhere around 1959, the San Pascual neighborhood became the Parish of San Pascual de Baylon, with the aforementioned saint serving as its Patron Saint.
Government edit
Local government edit
The municipal mayor is in charge of the municipality and serves as the head of the local government. The vice mayor serves as the mayor's deputy. Regarding the local legislature. The Sangguniang Bayan serves as the municipality's local legislature. The vice mayor serves as its president, and the council is made up of eight "councillors."
Representative edit
San Pascual is part of Batangas's 2nd congressional district. Gerville Luistro (Lakas-CMD) is the current representative of the 2nd district.
Geography edit
San Pascual is located at 13°48′N 121°02′E / 13.8°N 121.03°E.
According to the Philippine Statistics Authority, the municipality has a land area of 50.70 square kilometers (19.58 sq mi) [6] constituting 1.63% of the 3,119.75-square-kilometer (1,204.54 sq mi) total area of Batangas.
San Pascual is 5 kilometers (3.1 mi) from Batangas City and 110 kilometers (68 mi) from Manila.
Barangays edit
San Pascual is politically subdivided into 29 barangays.[7] Each barangay consists of puroks and some have sitios.
| PSGC | Barangay | Population | ±% p.a. | |||
|---|---|---|---|---|---|---|
| 2020[3] | 2010[8] | |||||
| 041026001 | Alalum | 3.1% | 2,155 | 1,986 | 0.82% | |
| 041026002 | Antipolo | 1.7% | 1,176 | 1,106 | 0.62% | |
| 041026003 | Balimbing | 2.4% | 1,648 | 522 | 12.18% | |
| 041026004 | Banaba | 3.9% | 2,662 | 2,440 | 0.87% | |
| 041026005 | Bayanan | 4.3% | 2,939 | 2,721 | 0.77% | |
| 041026006 | Danglayan | 1.2% | 841 | 580 | 3.78% | |
| 041026007 | Del Pilar | 1.1% | 759 | 667 | 1.30% | |
| 041026008 | Gelerang Kawayan | 2.2% | 1,533 | 1,519 | 0.09% | |
| 041026009 | Ilat North | 2.2% | 1,544 | 1,416 | 0.87% | |
| 041026010 | Ilat South | 2.0% | 1,363 | 1,385 | −0.16% | |
| 041026011 | Kaingin | 1.6% | 1,130 | 1,022 | 1.01% | |
| 041026012 | Laurel | 3.1% | 2,108 | 2,045 | 0.30% | |
| 041026013 | Malaking Pook | 1.1% | 780 | 756 | 0.31% | |
| 041026014 | Mataas na Lupa | 3.0% | 2,092 | 1,938 | 0.77% | |
| 041026015 | Natunuan North | 2.3% | 1,557 | 1,474 | 0.55% | |
| 041026016 | Natunuan South | 1.7% | 1,198 | 1,053 | 1.30% | |
| 041026017 | Padre Castillo | 1.7% | 1,189 | 960 | 2.16% | |
| 041026018 | Palsahingin | 1.5% | 1,065 | 980 | 0.84% | |
| 041026019 | Pila | 1.3% | 928 | 880 | 0.53% | |
| 041026020 | Poblacion | 14.8% | 10,188 | 9,977 | 0.21% | |
| 041026021 | Pook ni Banal | 2.0% | 1,347 | 1,223 | 0.97% | |
| 041026022 | Pook ni Kapitan | 1.3% | 927 | 752 | 2.11% | |
| 041026023 | Resplandor | 1.7% | 1,148 | 1,058 | 0.82% | |
| 041026024 | Sambat | 9.0% | 6,213 | 5,633 | 0.98% | |
| 041026025 | San Antonio | 13.2% | 9,096 | 8,639 | 0.52% | |
| 041026026 | San Mariano | 3.4% | 2,336 | 2,154 | 0.81% | |
| 041026027 | San Mateo | 2.4% | 1,651 | 1,201 | 3.23% | |
| 041026028 | Santa Elena | 0.9% | 650 | 595 | 0.89% | |
| 041026029 | Santo Niño | 4.6% | 3,201 | 2,916 | 0.94% | |
| Total | 69,009 | 59,598 | 1.48% | |||
Climate edit
| Climate data for San Pascual, Batangas | |||||||||||||
|---|---|---|---|---|---|---|---|---|---|---|---|---|---|
| Month | Jan | Feb | Mar | Apr | May | Jun | Jul | Aug | Sep | Oct | Nov | Dec | Year |
| Mean daily maximum °C (°F) | 28 (82) |
29 (84) |
31 (88) |
32 (90) |
31 (88) |
30 (86) |
29 (84) |
28 (82) |
28 (82) |
29 (84) |
29 (84) |
28 (82) |
29 (85) |
| Mean daily minimum °C (°F) | 19 (66) |
19 (66) |
20 (68) |
22 (72) |
24 (75) |
24 (75) |
24 (75) |
24 (75) |
24 (75) |
23 (73) |
21 (70) |
20 (68) |
22 (72) |
| Average precipitation mm (inches) | 11 (0.4) |
13 (0.5) |
14 (0.6) |
32 (1.3) |
101 (4.0) |
142 (5.6) |
208 (8.2) |
187 (7.4) |
175 (6.9) |
131 (5.2) |
68 (2.7) |
39 (1.5) |
1,121 (44.3) |
| Average rainy days | 5.2 | 5.0 | 7.4 | 11.5 | 19.8 | 23.5 | 27.0 | 25.9 | 25.2 | 23.2 | 15.5 | 8.3 | 197.5 |
| Source: Meteoblue[9] | |||||||||||||
Demographics edit
| Year | Pop. | ±% p.a. |
|---|---|---|
| 1970 | 19,377 | — |
| 1975 | 21,761 | +2.35% |
| 1980 | 26,221 | +3.80% |
| 1990 | 34,629 | +2.82% |
| 1995 | 40,849 | +3.14% |
| 2000 | 49,041 | +4.00% |
| 2007 | 57,200 | +2.15% |
| 2010 | 59,598 | +1.51% |
| 2015 | 65,424 | +1.79% |
| 2020 | 69,009 | +1.05% |
| Source: Philippine Statistics Authority[10][8][11][12] | ||
In the 2020 census, San Pascual had a population of 69,009.[3] The population density was 1,400 inhabitants per square kilometre (3,600/sq mi).
Economy edit
Graphs are unavailable due to technical issues. There is more info on Phabricator and on MediaWiki.org. |
As one of the towns adjacent to the province's capital, it is a bustling town full of businesses and establishments.
The town is home to an oil refinery, chemical plants and various subdivisions and housing projects, as well as other industrial and commercial establishments.
Hospitals edit
- Saint Pascal De Baylon Hospital
- San Antonio Life Care Hospital
Education edit
There are numerous elementary and high schools, offering primary and secondary education in the town of San Pascual. The most known high school in the municipality is the San Pascual National High School.
Gallery edit
-
 Welcome arch
 -
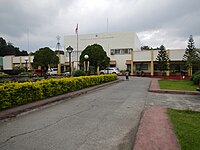 Municipal hall
 -
 San Pascual Baylon Parish Church
 -
 Public Market
 -
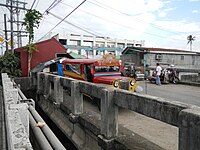
 Lagnas Bridge
 -
 Welcome sign
 -
 National road
 -
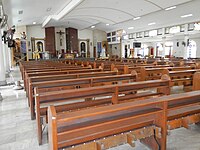 Inside of the Baylon Church


References edit
- ^ Municipality of San Pascual | (DILG)
- ^ "2015 Census of Population, Report No. 3 – Population, Land Area, and Population Density" (PDF). Philippine Statistics Authority. Quezon City, Philippines. August 2016. ISSN 0117-1453. Archived (PDF) from the original on May 25, 2021. Retrieved July 16, 2021.
- ^ a b c Census of Population (2020). "Region IV-A (Calabarzon)". Total Population by Province, City, Municipality and Barangay. Philippine Statistics Authority. Retrieved 8 July 2021.
- ^ "PSA Releases the 2018 Municipal and City Level Poverty Estimates". Philippine Statistics Authority. 15 December 2021. Retrieved 22 January 2022.
- ^ Republic Act No. 6116 (4 August 1969), "An Act Creating the Municipality of San Pascual in the Province of Batangas", Supreme Court E-Library, retrieved July 4, 2023
- ^ "Province: Batangas". PSGC Interactive. Quezon City, Philippines: Philippine Statistics Authority. Retrieved 12 November 2016.
- ^ "Municipal: San Pascual, Batangas". PSGC Interactive. Quezon City, Philippines: Philippine Statistics Authority. Retrieved 8 January 2016.
- ^ a b Census of Population and Housing (2010). "Region IV-A (Calabarzon)" (PDF). Total Population by Province, City, Municipality and Barangay. National Statistics Office. Retrieved 29 June 2016.
- ^ "San Pascual: Average Temperatures and Rainfall". Meteoblue. Retrieved 5 May 2020.
- ^ Census of Population (2015). "Region IV-A (Calabarzon)". Total Population by Province, City, Municipality and Barangay. Philippine Statistics Authority. Retrieved 20 June 2016.
- ^ Censuses of Population (1903–2007). "Region IV-A (Calabarzon)". Table 1. Population Enumerated in Various Censuses by Province/Highly Urbanized City: 1903 to 2007. National Statistics Office.
{{cite encyclopedia}}: CS1 maint: numeric names: authors list (link) - ^ "Province of Batangas". Municipality Population Data. Local Water Utilities Administration Research Division. Retrieved 17 December 2016.
- ^ "Poverty incidence (PI):". Philippine Statistics Authority. Retrieved December 28, 2020.
- ^ "Estimation of Local Poverty in the Philippines" (PDF). Philippine Statistics Authority. 29 November 2005.
- ^ "2003 City and Municipal Level Poverty Estimates" (PDF). Philippine Statistics Authority. 23 March 2009.
- ^ "City and Municipal Level Poverty Estimates; 2006 and 2009" (PDF). Philippine Statistics Authority. 3 August 2012.
- ^ "2012 Municipal and City Level Poverty Estimates" (PDF). Philippine Statistics Authority. 31 May 2016.
- ^ "Municipal and City Level Small Area Poverty Estimates; 2009, 2012 and 2015". Philippine Statistics Authority. 10 July 2019.
- ^ "PSA Releases the 2018 Municipal and City Level Poverty Estimates". Philippine Statistics Authority. 15 December 2021. Retrieved 22 January 2022.