Opinion polling for the 2009 Portuguese legislative election
In the run up to the 2009 Portuguese legislative election, various organisations carried out opinion polling to gauge voting intention in Portugal. Results of such polls are displayed in this article.
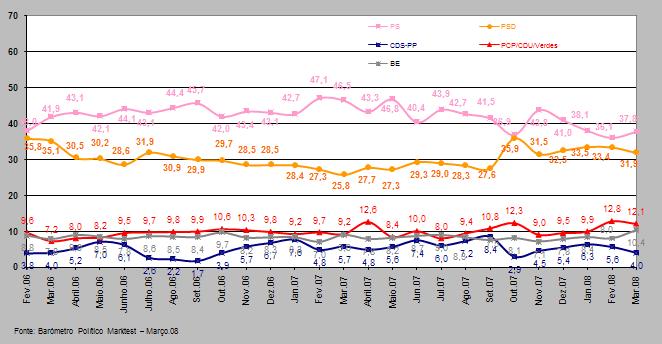
The date range for these opinion polls are from the previous general election, held on 20 February 2005, to the day the next election was held, on 27 September 2009.
Nationwide polling edit
Graphical summary edit
Graphs are unavailable due to technical issues. There is more info on Phabricator and on MediaWiki.org. |
Polling edit
Poll results are listed in the table below in reverse chronological order, showing the most recent first. The highest percentage figure in each polling survey is displayed in bold, and the background shaded in the leading party's colour. In the instance that there is a tie, then no figure is shaded but both are displayed in bold. The lead column on the right shows the percentage-point difference between the two parties with the highest figures. Poll results use the date the survey's fieldwork was done, as opposed to the date of publication.
Exit poll
| Date | Polling Firm/Source | Others | Lead | |||||
|---|---|---|---|---|---|---|---|---|
| 27 Sep 2009 | 2009 legislative election | 36.6 97 |
29.1 81 |
7.9 15 |
10.4 21 |
9.8 16 |
6.2 0 |
7.5 |
| 27 Sep (21:00) | Eurosondagem[a] | 36.5 | 28.0 | 8.3 | 10.6 | 10.2 | 6.4 | 8.5 |
| 27 Sep (20:00) | Eurosondagem[a] | 38.3 | 28.8 | 7.6 | 8.8 | 10.1 | 6.4 | 9.5 |
| 27 Sep | Intercampus[a] | 38.0 | 28.3 | 7.5 | 10.1 | 10.0 | 6.1 | 9.7 |
| 27 Sep | UCP–CESOP[a] | 38.0 | 27.0 | 8.5 | 10.0 | 10.5 | 6.0 | 11.0 |
| 21–24 Sep | Aximage | 36.6 | 27.5 | 8.0 | 8.1 | 9.2 | 10.6 | 9.1 |
| 21–23 Sep | Intercampus | 38.0 | 29.9 | 8.4 | 7.7 | 9.4 | 6.6 | 8.1 |
| 17–22 Sep | UCP–CESOP | 38.0 | 30.0 | 7.0 | 8.0 | 11.0 | 6.0 | 8.0 |
| 18–21 Sep | Marktest | 40.0 | 31.6 | 7.2 | 8.2 | 9.0 | 4.0 | 8.4 |
| 14–17 Sep | Aximage | 36.1 | 29.7 | 7.5 | 7.6 | 10.0 | 9.1 | 6.4 |
| 13–16 Sep | Eurosondagem | 34.9 | 31.6 | 8.4 | 8.4 | 9.6 | 7.1 | 3.3 |
| 12–15 Sep | Intercampus | 32.9 | 29.7 | 9.2 | 7.0 | 12.0 | 9.2 | 3.2 |
| 11–14 Sep | UCP–CESOP | 38.0 | 32.0 | 7.0 | 7.0 | 12.0 | 4.0 | 6.0 |
| 6–9 Sep | Eurosondagem | 33.6 | 32.5 | 9.4 | 8.0 | 9.6 | 6.9 | 1.1 |
| 4–8 Sep | UCP–CESOP | 37.0 | 35.0 | 8.0 | 6.0 | 11.0 | 3.0 | 2.0 |
| 4–7 Sep | Marktest | 35.3 | 32.4 | 6.9 | 5.2 | 16.2 | 4.0 | 2.9 |
| 1–4 Sep | Aximage | 34.5 | 28.9 | 7.8 | 8.1 | 10.4 | 10.3 | 5.6 |
| 23–28 Jul | Eurosondagem | 33.0 | 31.1 | 9.4 | 8.5 | 10.0 | 8.0 | 1.9 |
| 14–18 Jul | Marktest | 35.5 | 34.2 | 7.4 | 4.4 | 14.3 | 4.2 | 1.3 |
| 1–6 Jul | Aximage | 30.5 | 30.3 | 9.5 | 6.1 | 13.3 | 10.3 | 0.2 |
| 25–30 Jun | Eurosondagem | 35.1 | 33.0 | 9.7 | 7.4 | 9.6 | 5.2 | 2.1 |
| 16–20 Jun | Marktest | 34.5 | 35.8 | 7.7 | 4.4 | 13.1 | 4.5 | 1.3 |
| 7 Jun 2009 | 2009 EP elections | 26.5 | 31.7 | 10.6 | 8.4 | 10.7 | 12.1 | 5.2 |
| 7 Jun | Intercampus | 36.9 | 31.2 | 10.3 | 6.4 | 13.1 | 2.1 | 5.7 |
| 1–4 Jun | Aximage | 35.3 | 29.8 | 9.0 | 6.5 | 11.5 | 7.9 | 5.5 |
| 28 May–2 Jun | Eurosondagem | 39.6 | 33.0 | 7.9 | 5.6 | 9.1 | 4.8 | 6.6 |
| 20–22 May | Marktest | 36.3 | 28.3 | 9.4 | 7.1 | 14.7 | 4.2 | 8.0 |
| 5–7 May | Aximage | 37.3 | 26.7 | 8.5 | 5.2 | 12.6 | 9.7 | 10.6 |
| 30 Apr–5 May | Eurosondagem | 38.8 | 30.5 | 9.2 | 6.9 | 9.8 | 4.8 | 8.3 |
| 25–26 Apr | UCP–CESOP | 41.0 | 34.0 | 7.0 | 2.0 | 12.0 | 4.0 | 7.0 |
| 14–19 Apr | Marktest | 36.2 | 26.4 | 11.2 | 8.3 | 13.6 | 4.3 | 9.8 |
| 1–3 Apr | Aximage | 38.1 | 25.1 | 10.3 | 5.7 | 12.6 | 8.2 | 13.0 |
| 25–31 Mar | Eurosondagem | 39.6 | 29.6 | 9.4 | 7.0 | 9.6 | 4.8 | 10.0 |
| 17–21 Mar | Marktest | 36.7 | 28.4 | 8.9 | 9.4 | 12.6 | 4.0 | 8.3 |
| 2–5 Mar | Aximage | 38.3 | 24.0 | 9.0 | 6.8 | 12.6 | 9.3 | 14.3 |
| 26 Feb–3 Mar | Eurosondagem | 39.0 | 28.3 | 9.6 | 7.7 | 10.4 | 5.0 | 10.7 |
| 17–22 Feb | Marktest | 38.2 | 28.8 | 10.6 | 4.1 | 14.0 | 4.3 | 9.4 |
| 2–5 Feb | Aximage | 38.2 | 23.8 | 9.2 | 7.7 | 12.0 | 9.1 | 14.4 |
| 28 Jan–3 Feb | Eurosondagem | 40.3 | 29.1 | 8.8 | 6.9 | 10.1 | 4.8 | 11.2 |
| 20–23 Jan | Marktest | 39.6 | 24.9 | 11.9 | 9.7 | 10.1 | 3.8 | 14.7 |
| 7–13 Jan | Eurosondagem | 41.1 | 30.1 | 8.3 | 6.1 | 9.6 | 4.8 | 11.0 |
| 6–9 Jan | Aximage[permanent dead link] | 37.3 | 23.3 | 8.1 | 7.7 | 11.4 | 12.2 | 14.0 |
| 2009 | ||||||||
| 16–19 Dec | Marktest | 39.9 | 25.7 | 11.0 | 8.0 | 11.6 | 3.8 | 14.2 |
| 13–14 Dec | UCP–CESOP | 41.0 | 30.0 | 10.0 | 4.0 | 9.0 | 6.0 | 11.0 |
| 3–5 Dec | Aximage | 37.9 | 25.9 | 8.4 | 6.2 | 9.5 | 12.1 | 12.0 |
| 27 Nov–2 Dec | Eurosondagem | 42.5 | 30.0 | 8.4 | 6.0 | 8.7 | 4.4 | 12.5 |
| 18–21 Nov | Marktest | 40.1 | 26.4 | 10.0 | 6.2 | 13.1 | 4.2 | 13.7 |
| 5 Nov | Eurosondagem | 41.8 | 32.1 | 8.5 | 5.2 | 8.4 | 4.0 | 9.7 |
| 3–5 Nov | Aximage | 38.6 | 26.1 | 9.0 | 4.7 | 9.1 | 12.5 | 12.5 |
| 21–24 Oct | Marktest | 39.8 | 28.7 | 10.0 | 6.4 | 11.4 | 3.7 | 11.1 |
| 17–21 Oct | Intercampus | 43.9 | 28.9 | 10.2 | 4.0 | 12.3 | 0.8 | 15.0 |
| 6–8 Oct | Aximage | 38.0 | 28.5 | 9.2 | 3.8 | 9.3 | 11.2 | 9.5 |
| 4–5 Oct | UCP–CESOP | 41.0 | 34.0 | 8.0 | 2.0 | 8.0 | 7.0 | 7.0 |
| 25–30 Sep | Eurosondagem | 40.2 | 33.3 | 9.9 | 4.8 | 7.7 | 4.1 | 6.9 |
| 16–20 Sep | Marktest | 36.1 | 29.3 | 12.6 | 7.1 | 10.9 | 4.0 | 6.8 |
| 8–10 Sep | Aximage | 35.7 | 28.9 | 10.4 | 3.8 | 9.3 | 11.9 | 6.8 |
| 27 Aug–2 Sep | Eurosondagem | 39.0 | 33.0 | 10.1 | 5.0 | 8.4 | 4.5 | 6.0 |
| 28–29 Jul | Aximage | 33.1 | 31.1 | 9.1 | 4.4 | 9.4 | 12.9 | 2.0 |
| 23–29 Jul | Eurosondagem | 39.6 | 32.0 | 10.0 | 5.5 | 8.1 | 4.8 | 7.6 |
| 15–18 Jul | Marktest | 36.7 | 32.7 | 10.0 | 5.1 | 11.4 | 4.1 | 4.0 |
| 5–9 Jul | UCP–CESOP | 40.0 | 32.0 | 10.0 | 3.0 | 7.0 | 8.0 | 8.0 |
| 1–4 Jul | Aximage[permanent dead link] | 32.5 | 32.0 | 9.7 | 4.3 | 8.2 | 13.3 | 0.5 |
| 26 Jun–1 Jul | Eurosondagem | 40.0 | 29.0 | 10.1 | 6.0 | 9.6 | 5.3 | 11.0 |
| 17–21 Jun | Marktest | 35.2 | 30.8 | 11.1 | 6.7 | 12.3 | 3.9 | 4.4 |
| 28 May–3 Jun | Eurosondagem | 41.8 | 25.0 | 11.0 | 6.9 | 10.0 | 5.3 | 16.8 |
| 19–26 May | Marktest | 33.0 | 32.0 | 12.8 | 6.7 | 11.3 | 4.2 | 1.0 |
| 7–8 May | Aximage[permanent dead link] | 36.5 | 29.0 | 34.5 | 7.5 | |||
| 23–29 Apr | Eurosondagem | 43.2 | 26.9 | 10.0 | 6.3 | 8.8 | 4.8 | 16.3 |
| 15–18 Apr | Marktest | 38.0 | 31.5 | 10.8 | 4.3 | 11.5 | 3.9 | 6.5 |
| 2–4 Apr | Aximage | 35.7 | 26.0 | 8.9 | 5.1 | 10.2 | 14.1 | 9.7 |
| 27 Mar–1 Apr | Eurosondagem | 42.1 | 29.4 | 9.6 | 6.0 | 8.4 | 4.5 | 12.7 |
| 17–20 Mar | Marktest | 37.8 | 31.9 | 12.1 | 4.0 | 10.4 | 3.8 | 5.9 |
| 3–5 Mar | Aximage | 33.8 | 28.4 | 9.2 | 4.5 | 8.5 | 15.6 | 5.4 |
| 20–26 Feb | Eurosondagem | 43.2 | 31.2 | 8.3 | 5.8 | 7.2 | 4.3 | 12.0 |
| 23–24 Feb | UCP–CESOP | 39.0 | 32.0 | 9.0 | 3.0 | 8.0 | 9.0 | 7.0 |
| 19–21 Feb | Marktest | 36.1 | 33.4 | 12.8 | 5.6 | 8.0 | 4.1 | 2.7 |
| 1–4 Feb | Aximage | 35.8 | 30.0 | 8.2 | 4.6 | 7.2 | 14.2 | 5.8 |
| 24–28 Jan | Eurosondagem | 42.5 | 33.0 | 8.0 | 6.3 | 6.9 | 3.3 | 9.5 |
| 15–18 Jan | Marktest | 38.1 | 33.5 | 9.9 | 6.3 | 8.4 | 3.8 | 4.6 |
| 7–9 Jan | Aximage[permanent dead link] | 35.2 | 31.8 | 9.1 | 4.6 | 6.6 | 12.7 | 3.4 |
| 2–8 Jan | Eurosondagem | 43.3 | 32.5 | 8.0 | 6.0 | 6.6 | 3.6 | 10.8 |
| 2008 | ||||||||
| 18–21 Dec | Marktest | 41.0 | 32.5 | 9.5 | 5.4 | 7.8 | 3.8 | 8.5 |
| 5–7 Dec | Aximage | 37.0 | 29.2 | 8.5 | 4.4 | 6.7 | 14.2 | 7.8 |
| 28 Nov–4 Dec | Eurosondagem | 44.2 | 32.1 | 8.6 | 5.9 | 6.3 | 2.9 | 12.1 |
| 20–23 Nov | Marktest | 43.8 | 31.5 | 9.0 | 4.5 | 7.1 | 4.1 | 12.3 |
| 7–9 Nov | Aximage | 36.1 | 27.8 | 8.1 | 3.8 | 6.6 | 17.6 | 8.3 |
| 24–30 Oct | Eurosondagem | 45.5 | 31.5 | 8.8 | 5.0 | 5.9 | 3.3 | 14.0 |
| 20–21 Oct | UCP–CESOP | 41.0 | 35.0 | 9.0 | 6.0 | 4.0 | 5.0 | 6.0 |
| 16–19 Oct | Marktest | 36.9 | 35.9 | 12.3 | 2.9 | 8.1 | 3.9 | 1.0 |
| 2 Oct | Eurosondagem | 45.4 | 28.9 | 10.1 | 5.2 | 5.9 | 4.5 | 16.5 |
| 1–2 Oct | Aximage | 34.8 | 27.3 | 9.0 | 3.1 | 6.8 | 19.0 | 7.5 |
| 18–21 Sep | Marktest | 41.5 | 27.6 | 10.8 | 8.4 | 7.5 | 4.2 | 13.9 |
| 3–4 Sep | Aximage | 34.6 | 28.3 | 11.1 | 3.8 | 5.7 | 16.5 | 6.3 |
| 22–28 Aug | Eurosondagem | 45.2 | 30.3 | 9.2 | 5.0 | 5.5 | 4.8 | 14.9 |
| 14–17 Aug | Marktest | 42.7 | 28.3 | 9.4 | 7.2 | 8.5 | 3.9 | 14.4 |
| 7 Aug | Eurosondagem | 43.5 | 33.0 | 7.7 | 4.8 | 6.9 | 4.1 | 10.5 |
| 21–22 Jul | Aximage | 38.5 | 28.2 | 10.2 | 4.3 | 5.8 | 13.0 | 10.3 |
| 17–20 Jul | Marktest | 43.9 | 29.0 | 8.0 | 6.0 | 9.0 | 4.1 | 14.9 |
| 4–6 Jul | Aximage | 40.4 | 26.9 | 32.7 | 13.5 | |||
| 19–22 Jun | Marktest | 40.4 | 29.3 | 10.0 | 7.4 | 8.7 | 4.2 | 11.1 |
| 5–7 Jun | Aximage | 38.5 | 26.2 | 35.3 | 12.3 | |||
| 24–29 May | Eurosondagem | 44.6 | 33.4 | 7.7 | 4.0 | 6.6 | 3.7 | 11.2 |
| 15–18 May | Marktest | 46.8 | 27.3 | 8.4 | 5.6 | 8.2 | 3.7 | 19.5 |
| 30 Apr–4 May | Aximage | 36.7 | 26.7 | 7.6 | 6.0 | 7.0 | 16.0 | 10.0 |
| 26 Apr–2 May | Eurosondagem | 42.2 | 33.5 | 8.9 | 3.7 | 7.7 | 4.0 | 8.7 |
| 17–20 Apr | Marktest | 43.3 | 27.7 | 12.6 | 4.8 | 7.8 | 3.8 | 15.6 |
| 16–18 Apr | Aximage | 36.9 | 28.2 | 7.3 | 6.3 | 7.5 | 13.8 | 8.7 |
| 30 Mar–4 Apr | Aximage | 35.7 | 30.0 | 7.0 | 6.5 | 7.9 | 12.9 | 5.7 |
| 28 Mar–2 Apr | Eurosondagem | 44.2 | 32.3 | 9.5 | 2.7 | 7.4 | 3.9 | 11.9 |
| 19–21 Mar | Marktest | 46.5 | 25.8 | 9.2 | 5.7 | 9.0 | 3.8 | 20.7 |
| 2 Mar | Eurosondagem | 45.4 | 32.0 | 8.6 | 3.8 | 6.4 | 3.8 | 13.4 |
| 1–2 Mar | Aximage | 37.4 | 31.2 | 6.2 | 6.3 | 7.6 | 11.3 | 6.2 |
| 13–16 Feb | Marktest | 47.1 | 27.3 | 9.7 | 4.8 | 7.0 | 4.1 | 19.8 |
| 31 Jan–2 Feb | Aximage | 39.0 | 29.4 | 6.5 | 5.0 | 6.0 | 14.1 | 9.6 |
| 25–30 Jan | Eurosondagem | 44.4 | 33.3 | 7.8 | 4.4 | 6.7 | 3.4 | 11.1 |
| 16–19 Jan | Marktest | 42.7 | 28.4 | 9.2 | 7.6 | 8.3 | 3.8 | 14.3 |
| 12 Jan | Eurosondagem | 45.5 | 34.4 | 7.7 | 4.0 | 6.6 | 1.8 | 11.1 |
| 7–9 Jan | Aximage | 38.9 | 28.4 | 8.2 | 3.4 | 4.9 | 16.2 | 10.5 |
| 2007 | ||||||||
| 19–22 Dec | Marktest | 43.1 | 28.5 | 9.8 | 6.7 | 8.3 | 3.6 | 14.6 |
| 5–7 Dec | Aximage | 40.9 | 28.6 | 7.1 | 3.0 | 3.9 | 16.5 | 12.3 |
| 29 Nov–5 Dec | Eurosondagem | 44.4 | 31.3 | 8.8 | 4.7 | 8.0 | 2.8 | 13.1 |
| 13–15 Nov | Marktest | 43.4 | 28.5 | 10.3 | 5.7 | 8.2 | 3.9 | 14.9 |
| 10 Nov | Eurosondagem | 43.7 | 32.2 | 9.2 | 4.6 | 6.9 | 3.4 | 11.5 |
| 6–8 Nov | Aximage | 39.4 | 29.3 | 7.2 | 2.8 | 3.9 | 17.4 | 10.1 |
| 17–20 Oct | Marktest | 42.0 | 29.7 | 10.6 | 3.9 | 9.7 | 4.1 | 12.3 |
| 2–4 Oct | Aximage | 38.2 | 29.7 | 7.3 | 3.4 | 4.7 | 16.7 | 8.5 |
| 27 Sep–3 Oct | Eurosondagem | 44.6 | 33.5 | 7.7 | 4.0 | 6.5 | 3.7 | 11.1 |
| 19–22 Sep | Marktest | 45.7 | 29.9 | 9.9 | 1.7 | 8.4 | 4.4 | 15.8 |
| 6–7 Sep | Aximage | 36.6 | 29.6 | 9.1 | 3.3 | 6.7 | 14.7 | 7.0 |
| 31 Aug–5 Sep | Eurosondagem | 44.2 | 34.3 | 7.1 | 5.0 | 5.9 | 3.5 | 9.9 |
| 15–18 Aug | Marktest | 44.4 | 30.9 | 9.8 | 2.2 | 8.5 | 4.2 | 13.5 |
| 18–21 Jul | Marktest | 43.1 | 31.9 | 9.7 | 2.6 | 8.6 | 4.1 | 11.2 |
| 29 Jun–4 Jul | Eurosondagem | 43.8 | 32.5 | 8.7 | 3.9 | 7.5 | 3.6 | 11.3 |
| 20–23 Jun | Marktest | 44.1 | 28.6 | 9.5 | 6.1 | 7.8 | 3.9 | 15.5 |
| 8 Jun | Eurosondagem | 43.0 | 34.5 | 8.0 | 4.9 | 6.9 | 2.7 | 8.5 |
| 2–3 Jun | Aximage | 36.8 | 31.7 | 7.6 | 3.8 | 5.7 | 14.4 | 5.1 |
| 16–19 May | Marktest | 42.1 | 30.2 | 8.2 | 7.0 | 8.5 | 4.0 | 11.9 |
| 4–5 May | Aximage | 37.5 | 32.2 | 8.2 | 4.6 | 3.8 | 13.7 | 5.3 |
| 26 Apr–2 May | Eurosondagem | 43.3 | 36.0 | 6.9 | 5.0 | 5.2 | 3.6 | 7.3 |
| 18–21 Apr | Marktest | 43.1 | 30.5 | 8.0 | 5.2 | 9.0 | 4.2 | 12.6 |
| 10 Apr | Eurosondagem | 42.4 | 36.6 | 7.7 | 4.7 | 5.0 | 3.6 | 5.8 |
| 1–3 Apr | Aximage | 37.8 | 34.2 | 7.6 | 3.8 | 4.4 | 12.2 | 3.6 |
| 21–24 Mar | Marktest | 41.9 | 35.1 | 7.2 | 4.0 | 7.8 | 4.0 | 6.8 |
| 2–7 Mar | Eurosondagem | 42.6 | 34.3 | 8.4 | 4.8 | 6.3 | 3.6 | 8.3 |
| 1–3 Mar | Aximage | 37.9 | 34.1 | 6.9 | 4.0 | 5.1 | 12.0 | 3.8 |
| 15–19 Feb | Marktest | 38.0 | 35.8 | 9.6 | 3.8 | 8.8 | 4.0 | 2.2 |
| 2–7 Feb | Eurosondagem | 41.4 | 36.0 | 8.0 | 5.2 | 5.8 | 3.6 | 5.4 |
| 1–3 Feb | Aximage | 37.9 | 34.5 | 6.9 | 4.4 | 7.3 | 9.0 | 3.4 |
| 5–10 Jan | Eurosondagem | 43.3 | 33.0 | 7.7 | 5.8 | 6.9 | 3.3 | 10.3 |
| 3–5 Jan | Aximage | 37.5 | 33.9 | 7.1 | 4.2 | 8.2 | 9.1 | 3.6 |
| 2006 | ||||||||
| 30 Nov–2 Dec | Aximage[permanent dead link] | 35.4 | 34.9 | 7.4 | 4.8 | 7.7 | 9.8 | 0.5 |
| 15–19 Nov | Marktest | 35.4 | 37.7 | 9.1 | 5.3 | 8.5 | 4.0 | 2.3 |
| 7–8 Nov | Aximage | 35.1 | 33.4 | 8.1 | 4.1 | 7.2 | 12.1 | 1.7 |
| 18–21 Oct | Marktest | 37.3 | 36.1 | 8.2 | 5.3 | 9.1 | 4.0 | 1.2 |
| 17–19 Oct | Aximage | 35.4 | 32.7 | 7.6 | 3.7 | 8.0 | 12.6 | 2.7 |
| 9 Oct 2005 | 2005 local elections | 35.9 | 39.9 | 10.9 | 3.1 | 3.0 | 7.2 | 4.0 |
| 22–27 Sep | Eurosondagem | 42.5 | 33.0 | 8.0 | 7.0 | 6.0 | 3.5 | 9.5 |
| 20–26 Sep | Marktest | 33.7 | 39.0 | 9.6 | 4.3 | 9.6 | 3.8 | 5.3 |
| 5–6 Sep | Aximage | 38.2 | 30.1 | 31.7 | 8.1 | |||
| 1–6 Sep | Eurosondagem | 43.0 | 31.9 | 7.8 | 6.2 | 6.8 | 4.2 | 11.1 |
| 19–22 Jul | Marktest | 43.0 | 31.2 | 8.2 | 4.0 | 9.4 | 4.2 | 11.8 |
| 1–5 Jul | Aximage | 40.4 | 28.4 | 6.5 | 4.5 | 7.2 | 13.0 | 12.0 |
| 18–20 Jun | UCP–CESOP | 42.0 | 31.0 | 11.0 | 3.0 | 8.0 | 5.0 | 11.0 |
| 14–17 Jun | Marktest | 46.5 | 27.7 | 10.8 | 4.2 | 6.9 | 3.9 | 18.8 |
| 3–6 Jun | Aximage | 45.7 | 26.0 | 5.8 | 3.1 | 6.7 | 12.7 | 19.3 |
| 17–19 May | Marktest | 48.8 | 30.2 | 6.0 | 4.2 | 6.8 | 4.0 | 18.6 |
| 3–4 May | Aximage | 46.1 | 26.5 | 6.6 | 4.9 | 5.2 | 10.7 | 19.6 |
| 19–22 Apr | Marktest | 45.7 | 30.6 | 7.2 | 4.5 | 8.1 | 3.9 | 15.1 |
| 3–4 Apr | Aximage | 44.7 | 29.3 | 7.2 | 4.8 | 5.8 | 8.2 | 15.4 |
| 15–18 Mar | Marktest | 51.7 | 26.3 | 6.5 | 5.0 | 6.7 | 3.8 | 25.4 |
| 20 Feb 2005 | 2005 legislative election | 45.0 121 |
28.8 75 |
7.5 14 |
7.2 12 |
6.4 8 |
5.1 0 |
16.2 |