No higher resolution available.
Timewave_9_11_2001.png (640 × 400 pixels, file size: 4 KB, MIME type: image/png)
| This is a file from the Wikimedia Commons. Information from its description page there is shown below. Commons is a freely licensed media file repository. You can help. |
Summary
| Description |
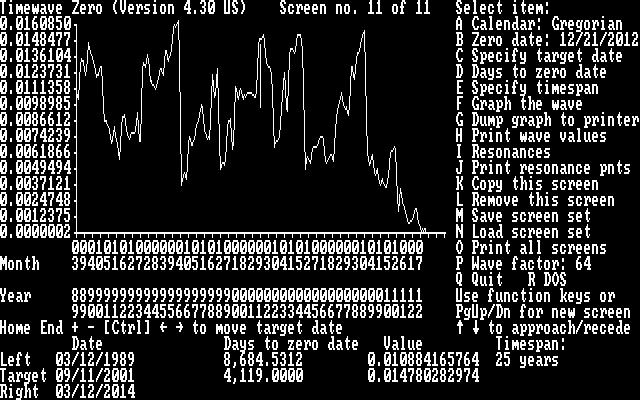
English: Screenshot of the Timewave Zero software graphing Terrence Mckenna's 'novelty wave' over a 25–year period. Higher points on the y axis represent instances of habitual trends in universal phenomena. Lower points indicate moments of increased novelty. The unconnected vertical line at the graph's midpoint indicates the location of the target date. |
| Date |
(original upload date) |
| Source | Transferred from en.wikipedia |
| Author |
Created by Clarknova, uploaded to Wikimedia Commons by John Manuel K. T. Original uploader was Clarknova at en.wikipedia |
| Permission (Reusing this file) |
Released into the public domain (by the author). |
Licensing
| |
This work has been released into the public domain by its author, Clarknova, at the English Wikipedia project. This applies worldwide. In case this is not legally possible: |
Original upload log
The original description page was here. All following user names refer to en.wikipedia.
- 2004-06-29 16:02 Clarknova 640×400× (23803 bytes) Screenshot of the ''Timewave Zero'' software graping Terrence Mckenna's 'novelty wave' over a period of 25 years. Higher points on the 'y' axis represent instances of habitual trends in universal phenomena. Lower points indicate moments of increased nov
File history
Click on a date/time to view the file as it appeared at that time.
| Date/Time | Thumbnail | Dimensions | User | Comment | |
|---|---|---|---|---|---|
| current | 06:50, 29 March 2009 | | 640 × 400 (4 KB) | CountingPine | Optimise file size using PNGOUT |
| 03:38, 3 February 2009 |  | 640 × 400 (23 KB) | JohnManuel | {{Information |Description={{en|Screenshot of the ''Timewave Zero'' software graphing Terrence Mckenna's 'novelty wave' over a 25–year period. Higher points on the ''y'' axis represent instances of habitual trends in universal phenomena. Lower points |
File usage
The following pages on the English Wikipedia use this file (pages on other projects are not listed):
Global file usage
The following other wikis use this file:
- Usage on es.wikipedia.org
- Usage on fr.wikipedia.org
- Usage on id.wikipedia.org
- Usage on it.wikipedia.org
- Usage on ko.wikipedia.org
- Usage on ms.wikipedia.org
- Usage on pl.wikipedia.org
- Usage on pt.wikipedia.org
- Usage on ru.wikipedia.org
- Usage on zh.wikipedia.org