Original file (1,134 × 1,333 pixels, file size: 90 KB, MIME type: image/png)
| This is a file from the Wikimedia Commons. Information from its description page there is shown below. Commons is a freely licensed media file repository. You can help. |
Summary
| Description |
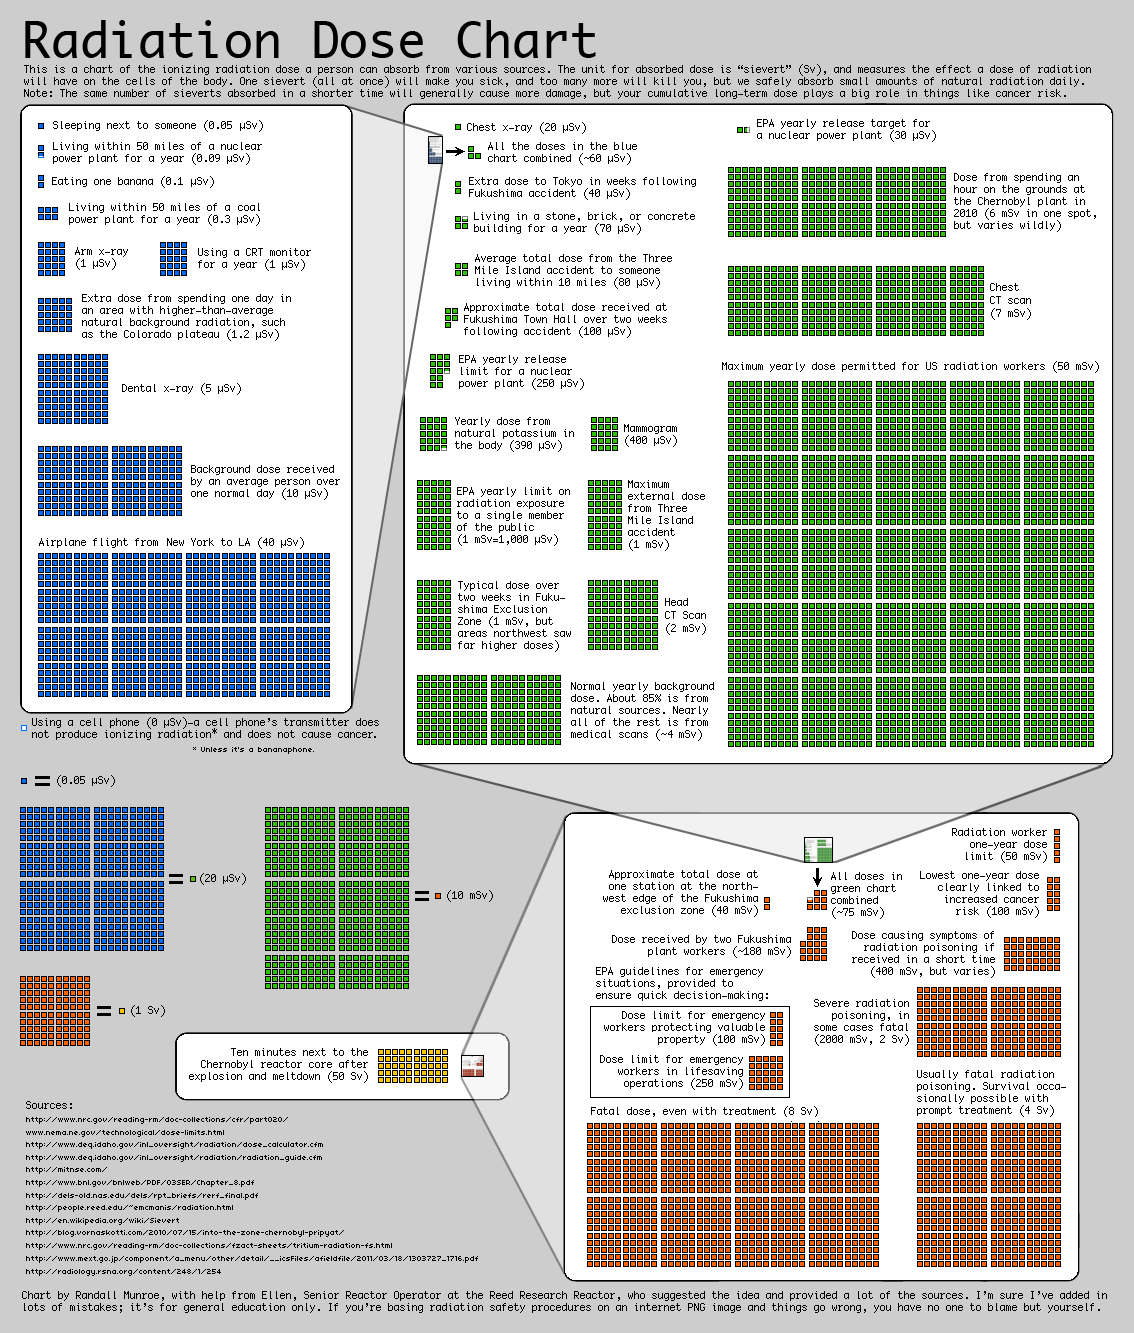
English: Radiation Dose Chart by Randall Munroe as part of the webcomic xkcd.
In response to concerns about the radioactivity released by the en:Fukushima Daiichi nuclear disaster:Fukushima Daiichi nuclear disaster in 2011, and to remedy what he described as "confusing" reporting on radiation levels in the media, Munroe created a chart of comparative radiation exposure levels. The chart was rapidly adopted by print and online journalists in several countries, including being linked to by online writers for The Guardian[1] and The New York Times.[2] As a result of requests for permission to reprint the chart and to translate it into Japanese, Munroe placed it in the public domain, but requested that his non-expert status should be clearly stated in any reprinting.[3]
Français : Graphique des doses radioactives par xkcd |
|||||||||||||||||||||||
| Date | ||||||||||||||||||||||||
| Source |
English: Source of the data, according to xkcd website: Français : Source des informations, selon le site de xkcd:
|
|||||||||||||||||||||||
| Author |
|
|||||||||||||||||||||||
| Permission (Reusing this file) |
From original page:
|
|||||||||||||||||||||||
| Other versions |
|
|||||||||||||||||||||||


.png)
.svg)

|
File:Exposure chart-XKCD.svg is a vector version of this file. It should be used in place of this PNG file when not inferior.
File:Radiation Dose Chart by Xkcd.png → File:Exposure chart-XKCD.svg
For more information, see Help:SVG. |
 |
Licensing
| This file is made available under the Creative Commons CC0 1.0 Universal Public Domain Dedication. | |
| The person who associated a work with this deed has dedicated the work to the public domain by waiving all of their rights to the work worldwide under copyright law, including all related and neighboring rights, to the extent allowed by law. You can copy, modify, distribute and perform the work, even for commercial purposes, all without asking permission.
|
This file, which was originally posted to
http://xkcd.com/radiation/, was reviewed on 24 March 2019 by reviewer Chiyako92, who confirmed that it was available there under the stated license on that date.
|
File history
Click on a date/time to view the file as it appeared at that time.
| Date/Time | Thumbnail | Dimensions | User | Comment | |
|---|---|---|---|---|---|
| current | 13:12, 15 December 2016 | | 1,134 × 1,333 (90 KB) | Jerryzhu2004 | Reverted to version as of 17:31, 7 March 2013 (UTC) |
| 12:06, 17 April 2015 |  | 1,134 × 1,333 (87 KB) | RokerHRO | optipng -o7 -i0 → 12.99% decrease | |
| 17:24, 15 May 2014 |  | 1,134 × 1,333 (100 KB) | Dougsim | Incorrect statement removed: sievert is not the unit of absorbed dose. It is the unit defined by the ICRP/ICRP, applied to many dose quantities of which effective dose is the central dose quantity. The chart has had a single amendment to remove the... | |
| 17:31, 7 March 2013 |  | 1,134 × 1,333 (90 KB) | CaZeRillo | Removed one mistake, "Extra dose to Tokyo in weeks ..." is supposed to be 40 µSv, not mSv, according to block size. | |
| 14:33, 23 May 2011 |  | 1,134 × 1,333 (90 KB) | Wwoods | ||
| 22:44, 28 March 2011 |  | 1,134 × 1,333 (88 KB) | Mwarren us | Reverted to version as of 16:13, 23 March 2011. Error in resolution of download appears to be from Google's Chrome browser. | |
| 22:35, 28 March 2011 |  | 1,134 × 1,333 (88 KB) | Mwarren us | Uploading png at original resolution of 1134x1333. | |
| 16:13, 23 March 2011 |  | 1,134 × 1,333 (88 KB) | Esby | {{Information |Description= {{mld |en=Radiation Dose Chart by Xkcd |fr=Graphique des doses radioactive par Xkcd }} |Source= http://xkcd.com/radiation/ |Date= 2011-03-23 |Author= Randall Munroe & Ellen |Permission= |other_versions= }} Category:Xkcd |
File usage
Global file usage
The following other wikis use this file:
- Usage on ar.wikipedia.org
- Usage on da.wikipedia.org
- Usage on en.wikivoyage.org
- Usage on es.wikipedia.org
- Usage on es.wikivoyage.org
- Usage on fr.wikipedia.org
- Usage on he.wikipedia.org
- Usage on hi.wikipedia.org
- Usage on it.wikipedia.org
- Usage on pl.wikipedia.org
- Usage on pt.wikipedia.org
- Usage on te.wikipedia.org
- Usage on uk.wikipedia.org
- Usage on www.wikidata.org
- Usage on zh.wikipedia.org