
Size of this PNG preview of this SVG file: 443 × 428 pixels. Other resolutions: 248 × 240 pixels | 497 × 480 pixels | 795 × 768 pixels | 1,060 × 1,024 pixels | 2,120 × 2,048 pixels.
Original file (SVG file, nominally 443 × 428 pixels, file size: 53 KB)
| This is a file from the Wikimedia Commons. Information from its description page there is shown below. Commons is a freely licensed media file repository. You can help. |
Summary
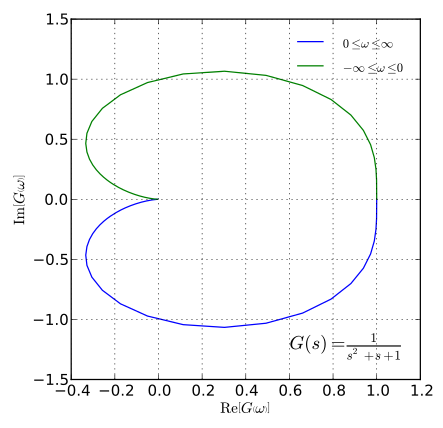
| Description | The Nyquist Plot for a sample function that can be converted to frequency by replacing with (imaginary frequency) and . Created using Python and matplotlib. |
| Date | |
| Source | Own work |
| Author | Utkarsh Upadhyay,--Krishnavedala (talk) 20:21, 3 June 2011 (UTC) (python version) |
| Permission (Reusing this file) |
Public Domain |


W3C-validity not checked.
| Source Code |
|---|
from numpy import *
from matplotlib.pyplot import *

def nyquist(w):		# compute the complex Nyquist response
	s = complex(0,w)
	return (1/(s**2+s+1))

fig = figure(figsize=(5,5))
ax = fig.add_subplot(111)
ax.grid(True)

t, N = linspace(0,5*pi,200), [] # 5*pi is approx. to infinity.
for i in t:			# compute the complex response for +ve omega
	N = append(N,nyquist(i))
ax.plot(real(N),imag(N),label=r"$0\leq\omega\leq\infty$")
t, N = linspace(-5*pi,0,200), []
for i in t:			# compute the complex response for -ve omega
	N = append(N,nyquist(i))
ax.plot(real(N),imag(N),label=r"$-\infty\leq\omega\leq 0$")
ax.legend(frameon=False)
setp(ax.get_legend().get_texts(),fontsize='small')
ax.set_xlabel(r"$\mathrm{Re}\left[G\left(\omega\right)\right]$")
ax.set_ylabel(r"$\mathrm{Im}\left[G\left(\omega\right)\right]$")
ax.text(0.6,-1.25,r"$G(s)=\frac{1}{s^2+s+1}$",\
	fontsize=15)

#fig.show()
fig.savefig("Nyquist example.svg",bbox_inches="tight",\
	pad_inches=.15)
|
Licensing
| I, the copyright holder of this work, release this work into the public domain. This applies worldwide. In some countries this may not be legally possible; if so: I grant anyone the right to use this work for any purpose, without any conditions, unless such conditions are required by law. |
File history
Click on a date/time to view the file as it appeared at that time.
| Date/Time | Thumbnail | Dimensions | User | Comment | |
|---|---|---|---|---|---|
| current | 20:10, 3 June 2011 | | 443 × 428 (53 KB) | Krishnavedala | corrected the equation in the curve |
| 20:04, 3 June 2011 |  | 443 × 428 (53 KB) | Krishnavedala | a well defined curve | |
| 20:55, 1 July 2010 |  | 1,000 × 1,000 (7 KB) | DieBucheBot | Trying to fix SVG using scour | |
| 02:36, 27 March 2007 |  | 1,000 × 1,000 (11 KB) | Musically ut | {{Information |Description=The Nyquist Plot for a sample function. |Source=Octave and GNU Plot |Date=27/03/06 |Author=Utkarsh Upadhyay |Permission=Public Domain |other_versions= - }} |
File usage
The following pages on the English Wikipedia use this file (pages on other projects are not listed):
Global file usage
The following other wikis use this file:
- Usage on fa.wikipedia.org
- Usage on fr.wikipedia.org
- Usage on hi.wikipedia.org
- Usage on it.wikipedia.org
- Usage on pt.wikipedia.org
- Usage on tr.wikipedia.org
- Usage on vi.wikipedia.org
- Usage on zh.wikipedia.org