
Size of this PNG preview of this SVG file: 426 × 331 pixels. Other resolutions: 309 × 240 pixels | 618 × 480 pixels | 989 × 768 pixels | 1,280 × 995 pixels | 2,560 × 1,989 pixels.
Original file (SVG file, nominally 426 × 331 pixels, file size: 172 KB)
| This is a file from the Wikimedia Commons. Information from its description page there is shown below. Commons is a freely licensed media file repository. You can help. |
Summary
| Description |
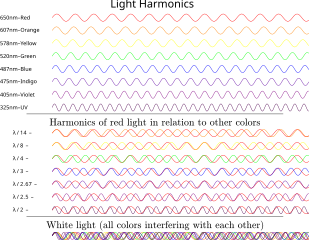
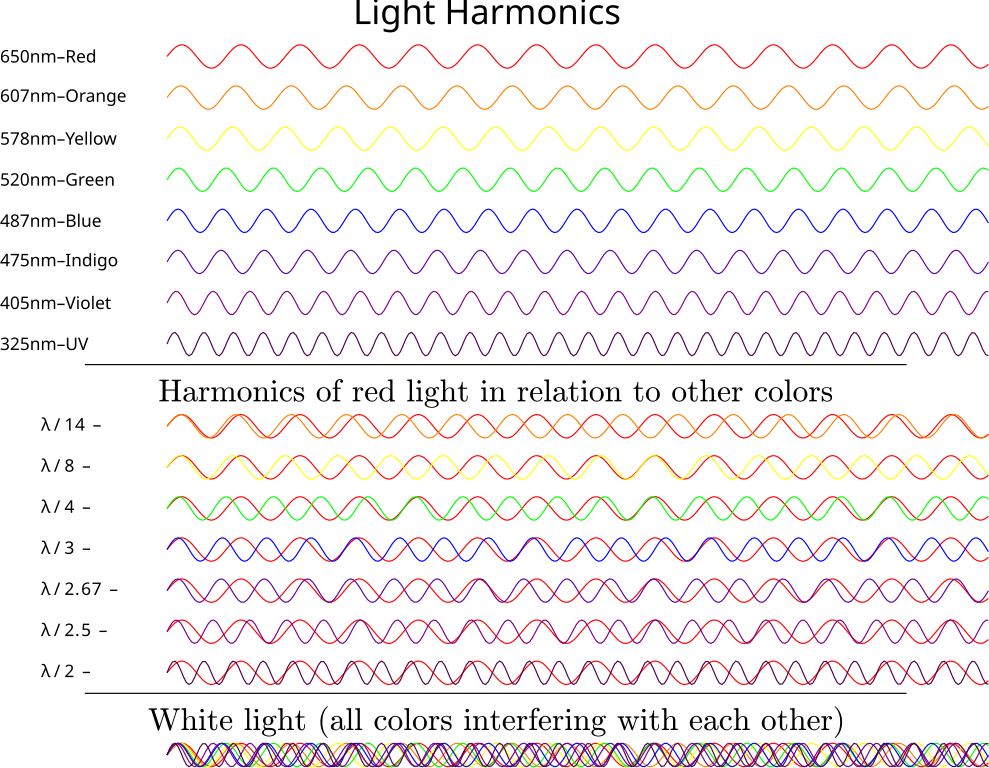
English: The harmonics of lightwaves drawn to scale, showing how the different waves interact with each other. The λ/2 (1/2 wavelength) harmonics are perfectly in sync with each other, but all other colors in the visual spectrum fall between λ and λ/2. Wavelengths that are separated by λ/4 are opposites, falling across from each other on the color wheel. (ie: Red is opposite of green, orange is opposite of blue, and yellow is opposite of violet.) Image was generated using Tikz and the resulting PDF was converted to SVG. |
||
| Date | |||
| Source | Own work | ||
| Author | Rubber Duck (☮ • ✍) | ||
| SVG development | This vector image was created with LaTeX.
| ||
| Source code | SVG code
|

Licensing
I, the copyright holder of this work, hereby publish it under the following licenses:
This file is licensed under the Creative Commons Attribution-Share Alike 3.0 Unported license.
- You are free:
- to share – to copy, distribute and transmit the work
- to remix – to adapt the work
- Under the following conditions:
- attribution – You must give appropriate credit, provide a link to the license, and indicate if changes were made. You may do so in any reasonable manner, but not in any way that suggests the licensor endorses you or your use.
- share alike – If you remix, transform, or build upon the material, you must distribute your contributions under the same or compatible license as the original.

|
Permission is granted to copy, distribute and/or modify this document under the terms of the GNU Free Documentation License, Version 1.2 or any later version published by the Free Software Foundation; with no Invariant Sections, no Front-Cover Texts, and no Back-Cover Texts. A copy of the license is included in the section entitled GNU Free Documentation License. |
You may select the license of your choice.
File history
Click on a date/time to view the file as it appeared at that time.
| Date/Time | Thumbnail | Dimensions | User | Comment | |
|---|---|---|---|---|---|
| current | 15:28, 19 September 2017 | | 426 × 331 (172 KB) | Krishnavedala | recreated file with editable text using "latex" and "dvisvgm" |
| 15:43, 22 April 2015 |  | 427 × 331 (147 KB) | Krishnavedala | better rendering using "dvisvgm". unicode characters replaced by hand | |
| 19:40, 6 April 2015 |  | 434 × 338 (295 KB) | Krishnavedala | {{Information |Description ={{en|1=The harmonics of lightwaves drawn to scale, showing how the different waves interact with each other. The λ/2 (1/2 wavelength) harmonics are perfectly in sync with each other, but all other colors in the visual sp... |
File usage
No pages on the English Wikipedia use this file (pages on other projects are not listed).
Global file usage
The following other wikis use this file:
- Usage on ar.wikipedia.org
- Usage on cs.wikipedia.org
- Usage on fa.wikipedia.org
- Usage on fa.wikibooks.org
- Usage on gl.wikipedia.org
- Usage on sr.wikipedia.org
- Usage on www.wikidata.org
- Usage on zh.wikipedia.org