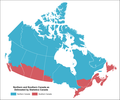
File:Canada North South Regions StatCan.png

Original file(2,700 × 2,250 pixels, file size: 132 KB, MIME type: image/png)

Summary

Description
English: This is an illustration of how Statistics Canada (StatCan) delineates the limits of northern and southern Canada. StatCan's source map is found at https://www150.statcan.gc.ca/n1/daily-quotidien/190704/mc-a001-eng.htm. StatCan's census consolidated subdivision cartographic boundaries were used to produce the illustration.
Date
Source Own work
Author Hwy43

Licensing

I, the copyright holder of this work, hereby publish it under the following license:
w:en:Creative Commons
attribution
This file is licensed under the Creative Commons Attribution 4.0 International license.
You are free:
  • to share – to copy, distribute and transmit the work
  • to remix – to adapt the work
Under the following conditions:
  • attribution – You must give appropriate credit, provide a link to the license, and indicate if changes were made. You may do so in any reasonable manner, but not in any way that suggests the licensor endorses you or your use.

Captions

Northern and southern Canada as delineated by Statistics Canada

Items portrayed in this file

depicts

15 August 2021

image/png

c75d36cdd2bc0a4c0f1ea6844ad4bdf258a4168f

135,335 byte

2,250 pixel

2,700 pixel

File history

Click on a date/time to view the file as it appeared at that time.

Date/TimeThumbnailDimensionsUserComment
current08:16, 15 August 2021Thumbnail for version as of 08:16, 15 August 20212,700 × 2,250 (132 KB)Hwy43remove margins
08:05, 15 August 2021Thumbnail for version as of 08:05, 15 August 20213,000 × 2,550 (142 KB)Hwy43remove satellite base to hopefully reduce image's fize size
08:00, 15 August 2021Thumbnail for version as of 08:00, 15 August 20213,000 × 2,550 (4.16 MB)Hwy43Uploaded own work with UploadWizard
The following pages on the English Wikipedia use this file (pages on other projects are not listed):

Metadata