
Size of this PNG preview of this SVG file: 723 × 578 pixels. Other resolutions: 300 × 240 pixels | 601 × 480 pixels | 961 × 768 pixels | 1,280 × 1,023 pixels | 2,560 × 2,047 pixels.
Original file (SVG file, nominally 723 × 578 pixels, file size: 11 KB)
| This is a file from the Wikimedia Commons. Information from its description page there is shown below. Commons is a freely licensed media file repository. You can help. |
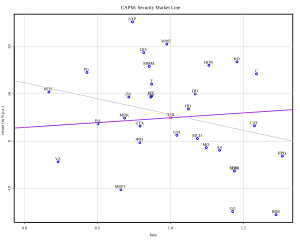
| Description | dow jones index and it's 30 stocks: the CAPM and the security market line (purple). the grey line is the linear model. mean yield is assumed to be 2.9% |
| Date | |
| Source | data by quote.yahoo, atomatically retrieved with GNU R, see graph source below |
| Author | Thomas Steiner |
| Permission (Reusing this file) |
Thomas Steiner put it under the CC-by-SA 2.5. |
This file is licensed under the Creative Commons Attribution-Share Alike 2.5 Generic license.
- You are free:
- to share – to copy, distribute and transmit the work
- to remix – to adapt the work
- Under the following conditions:
- attribution – You must give appropriate credit, provide a link to the license, and indicate if changes were made. You may do so in any reasonable manner, but not in any way that suggests the licensor endorses you or your use.
- share alike – If you remix, transform, or build upon the material, you must distribute your contributions under the same or compatible license as the original.
R source:
library(tseries)
library(RSvgDevice)

quote<-function(inst, nDs) {
  if(!inherits(try(open(url("http://quote.yahoo.com")), silent = TRUE), "try-error")) {
    start <- strftime(as.POSIXlt(Sys.time() - nDs*24*3600), format="%Y-%m-%d")
    end <- strftime(as.POSIXlt(Sys.time()), format = "%Y-%m-%d")
    x <- get.hist.quote(instrument=inst, start=start, end=end, quote = c("AdjClose"), compression="m",  quiet=T, retclass="zoo")
  }
  return(x)
}

yield=2.9
nDays=1042
comp<-c("^DJI", "AA", "AIG", "AXP", "BA", "C", "CAT", "DD", "DIS", "GE", "GM", "HD", "HON", "HPQ", "IBM", "INTC", "JNJ", "JPM", "KO", "MCD", "MMM", "MO", "MRK", "MSFT", "PFE", "PG", "T", "UTX", "VZ", "WMT", "XOM")

comp.quote<-quote(comp[1],nDays)
from= as.Date(index(comp.quote[1,1]),format="%Y-%m-%d")
to=   as.Date(index(comp.quote[length(comp.quote[,1]),1]),format="%Y-%m-%d")

for (c in 2:length(comp)) {
  comp.quote<-merge(comp.quote,quote(comp[c],nDays))
}

rdt<-12*diff(comp.quote)/comp.quote*100

points=array(NA,dim=c(length(comp),2))
for (p in 1:length(comp)) {
  points[p,1]= cov(rdt[,1],rdt[,p])/var(rdt[,1])
  points[p,2]=mean(rdt[,p])
}

devSVG(file="CAPM-SML.svg", width=10, height=8, bg="transparent", fg="black", onefile=TRUE, xmlHeader=TRUE)

par(lwd=2)
plot(points[2:length(comp),],type="p",col="blue",xlab="beta",ylab="return (in % p.a.)",main="CAPM: Security Market Line",xlim=range(0,points[,1]))
lines(points[1,1],points[1,2],col="red",type="p")
abline(a=yield,b=points[1,2]-yield,col="purple")
text(points[2:length(comp),1],points[2:length(comp),2],comp,pos=3,col="blue")
text(points[1,1],             points[1,2],           comp[1],pos=3,col="red")

lm1<-lm(points[,2]~points[,1])
abline(lm1,col="darkgrey",lwd=1)

text(x=par("usr")[2], y=par("usr")[3]+0.5, labels=paste("Dow Jones monthly data from", format.Date(from,"%d %b %Y"), "to", format.Date(to,"%d %b %Y"),""), col="grey",adj=c(1,0) )
grid(lwd=1)

dev.off()
File history
Click on a date/time to view the file as it appeared at that time.
| Date/Time | Thumbnail | Dimensions | User | Comment | |
|---|---|---|---|---|---|
| current | 14:08, 8 November 2006 | | 723 × 578 (11 KB) | Thire | {{Information| |Description = dow jones index and it's 30 stocks: the CAPM and the security market line (purple). the grey line is the linear model. mean yield is assumed to be 2.9% |Source = data by quote.yahoo, atomatically retrieved with GNU R, see gra |
File usage
The following pages on the English Wikipedia use this file (pages on other projects are not listed):
Global file usage
The following other wikis use this file:
- Usage on de.wikibooks.org
- Usage on en.wikibooks.org
- Usage on fa.wikipedia.org
- Usage on he.wikipedia.org
- Usage on he.wiktionary.org
- Usage on hi.wikipedia.org
- Usage on hy.wikipedia.org
- Usage on nl.wikipedia.org
- Usage on pt.wikipedia.org
- Usage on ru.wikipedia.org