No higher resolution available.
Boston_economy_chart.png (567 × 473 pixels, file size: 42 KB, MIME type: image/png)
| This is a file from the Wikimedia Commons. Information from its description page there is shown below. Commons is a freely licensed media file repository. You can help. |
Summary
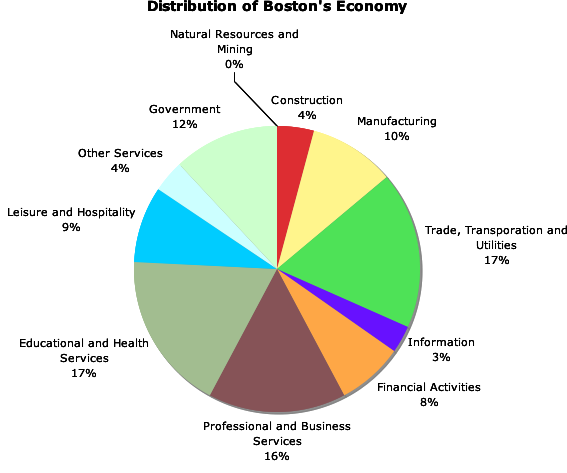
| Description | A pie chart made in w:Microsoft Excel demonstrating the distribution of the economy of w:Boston, Massachusetts. Data taken from [1]. |
| Date | |
| Source | Own work |
| Author | Admrboltz |
| Permission (Reusing this file) |
PD-Self |
Licensing
| I, the copyright holder of this work, release this work into the public domain. This applies worldwide. In some countries this may not be legally possible; if so: I grant anyone the right to use this work for any purpose, without any conditions, unless such conditions are required by law. |
File history
Click on a date/time to view the file as it appeared at that time.
| Date/Time | Thumbnail | Dimensions | User | Comment | |
|---|---|---|---|---|---|
| current | 18:52, 26 December 2007 | | 567 × 473 (42 KB) | Admrboltz | Removing legend. |
| 18:49, 26 December 2007 |  | 702 × 438 (52 KB) | Admrboltz | {{Information |Description=A pie chart made in w:Microsoft Excel demonstrating the distribution of the economy of Boston, Massachusetts. Data taken from [http://www.city-data.com/us-cities/The-Northeast/Boston-Economy.html]. |Source=self-made |Dat |
File usage
No pages on the English Wikipedia use this file (pages on other projects are not listed).
Global file usage
The following other wikis use this file: