Size of this preview: 750 × 600 pixels. Other resolutions: 300 × 240 pixels | 601 × 480 pixels | 1,002 × 801 pixels.
Original file (1,002 × 801 pixels, file size: 27 KB, MIME type: image/png)
| This is a file from the Wikimedia Commons. Information from its description page there is shown below. Commons is a freely licensed media file repository. You can help. |
Summary
Own work.
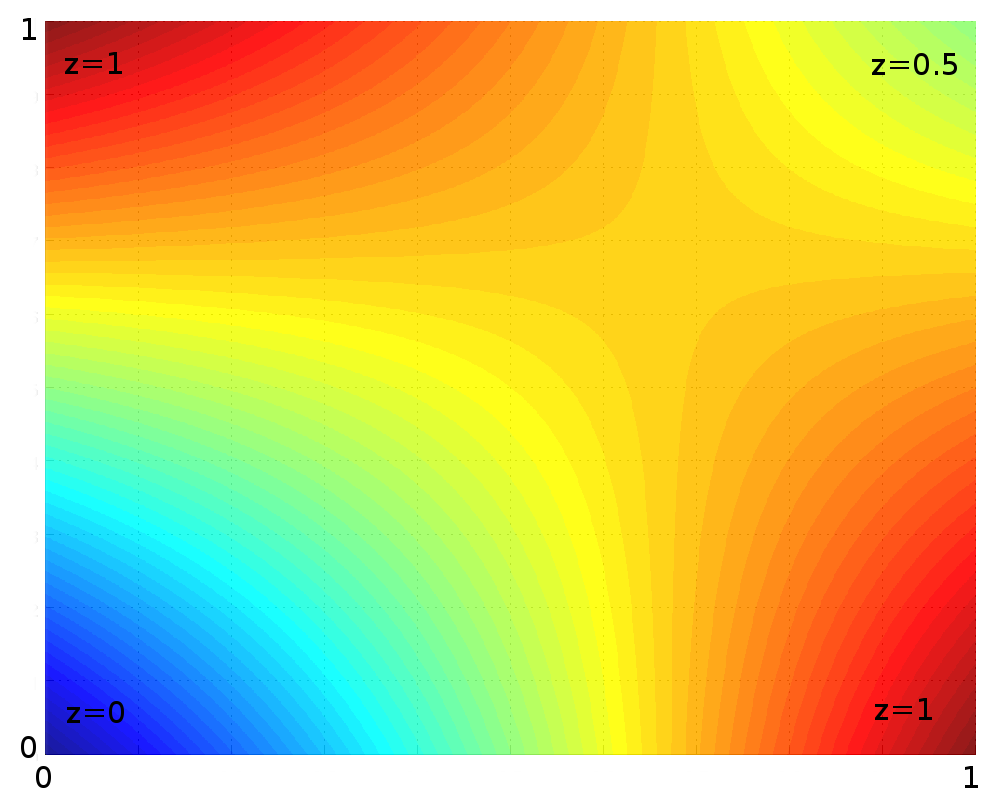
Illustrates bilinear interpolation on the unit square. The four corners have fixed values as indicated in the figure, and the values in between are interpolated, and the interpolated values are represented by the colour.
Done in Matlab, source code:
# Grid of known points:
>> [X, Y] = meshgrid(0:1)
# Grid for interpolated values:
>> [XI,YI] = meshgrid(0:0.001:1);
# Known values to interpolate from:
>> Z = [0 1; 1 0.5]
# Do bilinear interpolation
>> ZI = interp2(X,Y,Z,XI,YI);
# Visualize result:
>> surf(XI,YI,ZI, 'EdgeColor','none'); alpha(0.9)
>> view([0 90])
>> print -dpng Bilininterp.png
See also
Licensing
| I, the copyright holder of this work, release this work into the public domain. This applies worldwide. In some countries this may not be legally possible; if so: I grant anyone the right to use this work for any purpose, without any conditions, unless such conditions are required by law. |
File history
Click on a date/time to view the file as it appeared at that time.
| Date/Time | Thumbnail | Dimensions | User | Comment | |
|---|---|---|---|---|---|
| current | 09:12, 30 June 2023 | | 1,002 × 801 (27 KB) | Phreneticc | Reduced file weight with FileOptimizer in lossless compression mode. |
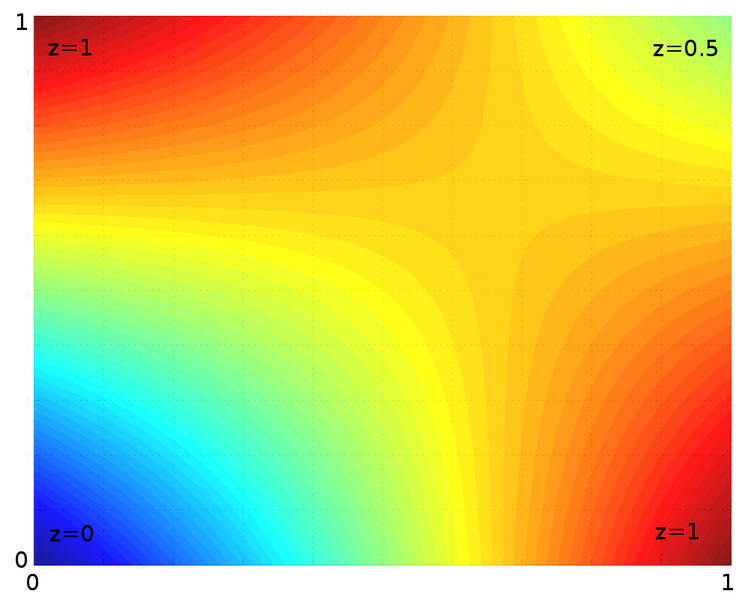
| 20:18, 21 March 2007 |  | 1,002 × 801 (37 KB) | Berland | Own work. Illustrates bilinear interpolation on the unit square. The four corners have fixed values as indicated in the figure, and the values in between are interpolated, and the interpolated values are represented by the colour. |
File usage
The following pages on the English Wikipedia use this file (pages on other projects are not listed):
Global file usage
The following other wikis use this file:
- Usage on ar.wikipedia.org
- Usage on cs.wikipedia.org
- Usage on es.wikipedia.org
- Usage on fa.wikipedia.org
- Usage on fi.wikipedia.org
- Usage on fr.wikipedia.org
- Usage on he.wikipedia.org
- Usage on ja.wikipedia.org
- Usage on pt.wikipedia.org
- Usage on ru.wikipedia.org
- Usage on tr.wikipedia.org
- Usage on uk.wikipedia.org
- Usage on zh.wikipedia.org