File:Afghanistan Population 1950-2021 Forecast 2022-2032 UN World Population Prospects 2022.svg

Original file (SVG file, nominally 1,074 × 535 pixels, file size: 34 KB)
| This is a file from the Wikimedia Commons. Information from its description page there is shown below. Commons is a freely licensed media file repository. You can help. |
Summary
| Description |
Deutsch: Visualisierung der von den Vereinten Nationen geschätzten jährlichen Bevölkerungsentwicklung für Afghanistan von 1950 - 2021; Vorhersage der Bevölkerungsentwicklung von 2022-2032 anhand der "mittleren Prognose" ("medium variant") der Vereinten Nationen.
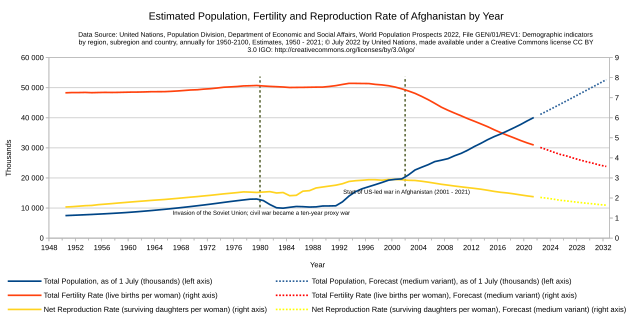
Originaltext der von den Vereinten Nationen verwendeten (englischen) Namen für die Daten übernommen. Gepunktete Kurven stellen grundsätzlich die Vorhersagen für die nächsten 10 Jahre anhand der mittleren Prognose ("medium variant") der Vereinten Nationen dar. Deutsche Übersetzung: Blaue Kurve: Gesamtbevölkerung jeweils zum 1. July in Tausend (linke y-Achse); Blaue gepunktete Kurve: Gesamtbevölkerung jeweils zum 1. July in Tausend, "Mittlere Prognose" ("Medium variant") (linke y-Achse) Rote Kurve: Gesamtfruchtbarkeitsrate (Lebendgeburten pro Frau) (rechte y-Achse); Rote gepunktete Kurve: Gesamtfruchtbarkeitsrate (Lebendgeburten pro Frau), "Mittlere Prognose" ("Medium variant") (rechte y-Achse) Gelbe Kurve: Nettoreproduktionsrate (überlebende Töchter pro Frau) (rechte y-Achse); Gelbe gepunktete Kurve: Nettoreproduktionsrate (überlebende Töchter pro Frau), "Mittlere Prognose" ("Medium variant") (rechte y-Achse) Datenquelle (Steht auch im Bild): United Nations, Population Division, Department of Economic and Social Affairs World Population Prospects 2022 File GEN/01/REV1: Demographic indicators by region, subregion and country, annually for 1950-2100 Estimates, 1950 - 2021 POP/DB/WPP/Rev.2022/GEN/F01/Rev.1 © July 2022 by United Nations, made available under a Creative Commons license CC BY 3.0 IGO: https://creativecommons.org/licenses/by/3.0/igo/ Link zur Datenquelle: https://population.un.org/wpp/Download/Standard/MostUsed/; Heruntergeladene Datei: "Complete (estimates and all projection scenarios)" (XLSX, 93,17 MB), abgerufen am 16.07.2022 Link zur Beschreibung der Daten: https://population.un.org/wpp/ Vorgeschlagene Zitierung: United Nations, Department of Economic and Social Affairs, Population Division (2022). World Population Prospects 2022, Online EditionEnglish: Visualization of the annual population trend estimated by the United Nations for Afghanistan from 1950 - 2021; projection of the population trend from 2022-2032 using the 'medium variant' of the United Nations.
Original names of terms used by the United Nations adopted. Dotted curves basically represent the forecasts for the next 10 years using the United Nations medium variant forecast. Blue curve: total population each July 1 in thousands (left y-axis); Blue dotted curve: total population each July 1 in thousands, Forecast ('medium variant') (left y-axis). Red curve: total fertility rate (live births per woman) (right y-axis); Red dotted curve: total fertility rate (live births per woman), Forecast ('medium variant') (right y-axis). Yellow curve: Net reproductive rate (surviving daughters per woman) (right y-axis); Yellow dotted curve: Net reproductive rate (surviving daughters per woman), Forecast ('medium variant') (right y-axis). Data source: United Nations, Population Division, Department of Economic and Social Affairs. World Population Prospects 2022 File GEN/01/REV1: Demographic indicators by region, subregion and country, annually for 1950-2100 Estimates, 1950 - 2021 POP/DB/WPP/Rev.2022/GEN/F01/Rev.1 © July 2022 by United Nations, made available under a Creative Commons license CC BY 3.0 IGO: https://creativecommons.org/licenses/by/3.0/igo/ Link to data source: https://population.un.org/wpp/Download/Standard/MostUsed/; Downloaded file: 'Complete (estimates and all projection scenarios)' (XLSX, 93.17 MB), retrieved on 07/16/2022 Link to the description of the data: https://population.un.org/wpp/ Suggested citation: United Nations, Department of Economic and Social Affairs, Population Division (2022). World Population Prospects 2022, Online Edition. |
| Date | |
| Source | Own work |
| Author | Eneliting |
Licensing
- You are free:
- to share – to copy, distribute and transmit the work
- to remix – to adapt the work
- Under the following conditions:
- attribution – You must give appropriate credit, provide a link to the license, and indicate if changes were made. You may do so in any reasonable manner, but not in any way that suggests the licensor endorses you or your use.
- share alike – If you remix, transform, or build upon the material, you must distribute your contributions under the same or compatible license as the original.
File history
Click on a date/time to view the file as it appeared at that time.
| Date/Time | Thumbnail | Dimensions | User | Comment | |
|---|---|---|---|---|---|
| current | 06:05, 24 August 2022 | | 1,074 × 535 (34 KB) | Eneliting | Historical events that changed the population size included in the diagram. |
| 08:28, 13 August 2022 |  | 1,074 × 524 (33 KB) | Eneliting | Uploaded own work with UploadWizard |
File usage
Global file usage
The following other wikis use this file:
- Usage on de.wikipedia.org
- Usage on ka.wikipedia.org