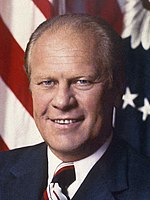
The 1976 United States presidential election in Connecticut took place on November 2, 1976. All 50 states and The District of Columbia, were part of the 1976 United States presidential election. Connecticut voters chose eight electors to the Electoral College, who voted for president and vice president.
| ||||||||||||||||||||||||||
| ||||||||||||||||||||||||||
| ||||||||||||||||||||||||||
| ||||||||||||||||||||||||||
Connecticut was won by the Republican nominees, incumbent President Gerald Ford of Michigan and his running mate Senator Bob Dole of Kansas. Ford and Dole defeated the Democratic nominees, Governor Jimmy Carter of Georgia and his running mate Senator Walter Mondale of Minnesota.
Ford narrowly carried Connecticut with 52.06% of the vote to Carter's 46.90%, a victory margin of 5.16%.[1] As of the 2020 United States presidential election[update], this is the last time a Democrat has won the presidency without carrying Connecticut. The state would not vote for a losing candidate again until 2000, and for the loser of the popular vote until 2004.
Results edit
| 1976 United States presidential election in Connecticut[2] | |||||
|---|---|---|---|---|---|
| Party | Candidate | Votes | Percentage | Electoral votes | |
| Republican | Gerald Ford (incumbent) | 719,261 | 52.06% | 8 | |
| Democratic | Jimmy Carter | 647,895 | 46.90% | 0 | |
| American Independent | Lester Maddox | 7,101 | 0.51% | 0 | |
| Write-ins | Write-ins | 5,480 | 0.40% | 0 | |
| U.S. Labor | Lyndon LaRouche | 1,789 | 0.13% | 0 | |
| Totals | 1,380,733 | 100.00% | 8 | ||
| Voter turnout | - | ||||
By county edit
| County | Gerald Ford Republican |
Jimmy Carter Democratic |
Various candidates Other parties |
Margin | Total votes cast | ||||
|---|---|---|---|---|---|---|---|---|---|
| # | % | # | % | # | % | # | % | ||
| Fairfield | 209,458 | 58.15% | 148,353 | 41.18% | 2,413 | 0.67% | 61,105 | 16.97% | 360,224 |
| Hartford | 175,064 | 47.51% | 191,257 | 51.90% | 2,173 | 0.59% | -16,193 | -4.39% | 368,494 |
| Litchfield | 40,705 | 55.32% | 32,419 | 44.06% | 459 | 0.62% | 8,286 | 11.26% | 73,583 |
| Middlesex | 31,115 | 51.39% | 29,097 | 48.05% | 338 | 0.56% | 2,018 | 3.34% | 60,550 |
| New Haven | 174,342 | 52.17% | 157,402 | 47.10% | 2,445 | 0.73% | 16,940 | 5.07% | 334,189 |
| New London | 47,231 | 50.40% | 45,908 | 48.98% | 581 | 0.62% | 1,323 | 1.42% | 93,720 |
| Tolland | 23,703 | 50.41% | 23,079 | 49.08% | 242 | 0.51% | 624 | 1.33% | 47,024 |
| Windham | 17,643 | 46.11% | 20,380 | 53.26% | 239 | 0.63% | -2,737 | -7.15% | 38,262 |
| Totals | 719,261 | 52.06% | 647,895 | 46.90% | 14,370 | 1.04% | 71,366 | 5.16% | 1,381,526 |
Counties that flipped from Republican to Democratic edit
See also edit
References edit
- ^ "1976 Presidential General Election Results - Connecticut". Dave Leip's Atlas of U.S. Presidential Elections. Retrieved April 9, 2015.
- ^ "1976 Presidential General Election Results - Connecticut". Dave Leip's Atlas of U.S. Presidential Elections. Retrieved April 9, 2015.


