Piscataquis County (/pɪˈskætəkwɪs/ pih-SKAT-ə-kwiss) is a county located in the U.S. state of Maine. As of the 2020 census, its population was 16,800, making it Maine's least-populous county.[1] Its county seat is Dover-Foxcroft.[2] The county was incorporated on March 23, 1838, taken from the western part of Penobscot County and the eastern part of Somerset County. It is named for an Abenaki word meaning "branch of the river" or "at the river branch."
Piscataquis County | |
|---|---|
 | |
 Location within the U.S. state of Maine | |
 Maine's location within the U.S. | |
| Coordinates: 45°33′55″N 69°20′01″W / 45.565186°N 69.333687°W | |
| Country | |
| State | |
| Founded | March 23, 1838 |
| Named for | Piscataquis River |
| Seat | Dover-Foxcroft |
| Largest town | Dover-Foxcroft |
| Area | |
| • Total | 4,378 sq mi (11,340 km2) |
| • Land | 3,961 sq mi (10,260 km2) |
| • Water | 417 sq mi (1,080 km2) 9.5% |
| Population (2020) | |
| • Total | 16,800 |
| • Density | 3.8/sq mi (1.5/km2) |
| Time zone | UTC−5 (Eastern) |
| • Summer (DST) | UTC−4 (EDT) |
| Congressional district | 2nd |
| Website | www |
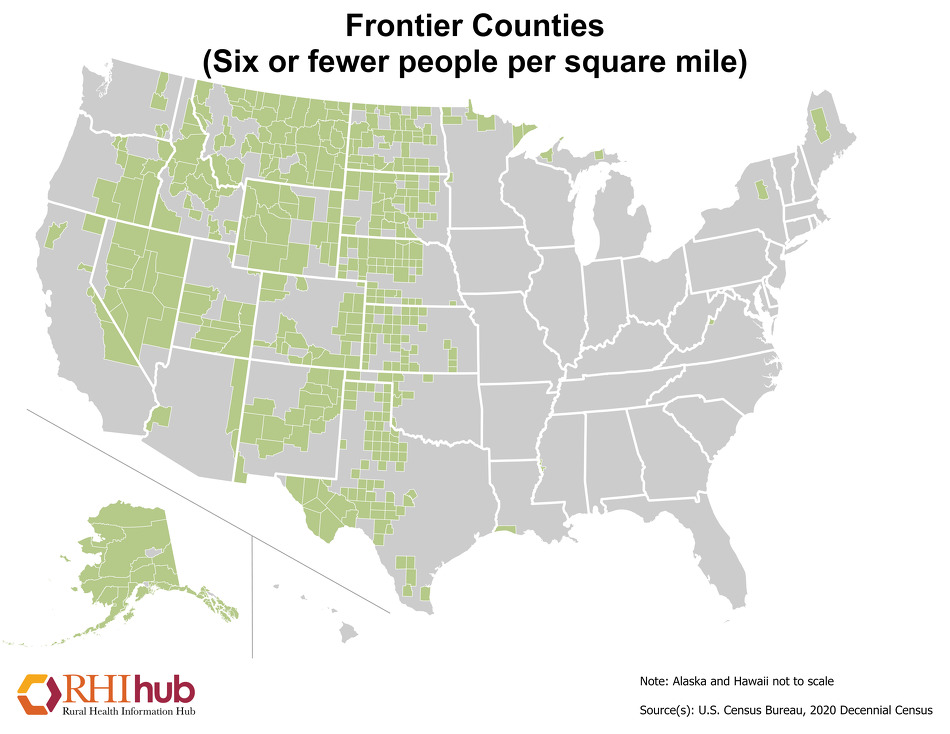
Originally, the county extended north to the Canada–US border, but in 1844 its northern portion was annexed by Aroostook County. In terms of land area, Piscataquis is one of the largest U.S. counties east of the Mississippi River. It is also one of two counties in the Northeast (and seven counties east of the Mississippi River)[3][a] that meet Frederick Jackson Turner's requirements for "frontier" country – that is, having fewer than six inhabitants per square mile, the other being Hamilton County, New York.
Baxter State Park, a large wilderness preserve, is located in Piscataquis County.
History edit
In June 1799, near Piscataquis County's three major rivers, people started clearing land and settling there.[4]
In 1883, the Monson Railroad, a two-foot gague commoner railroad, began operating in the county. It would be the last operating railroad of its type in North America.[5]
From the 1970s to the 1990s, paper companies' land in the county was heavily harvested.[6]
Geography edit
According to the U.S. Census Bureau, the county has a total area of 4,378 square miles (11,340 km2), of which 3,961 square miles (10,260 km2) is land and 417 square miles (1,080 km2) (9.5%) is water.[7] It is the second-largest county in Maine by area. The largest lake in the county is Moosehead Lake (the state’s largest) at 120 square miles (310 km2). The highest natural point in the county and the state of Maine is Mount Katahdin at 5,271 feet (1,607 meters), while the geographic center is Greeley Landing in the Town of Dover-Foxcroft.
Adjacent counties edit
- Aroostook County – north
- Penobscot County – southeast
- Somerset County – west
Demographics edit
| Census | Pop. | Note | %± |
|---|---|---|---|
| 1840 | 13,138 | — | |
| 1850 | 14,735 | 12.2% | |
| 1860 | 15,032 | 2.0% | |
| 1870 | 14,403 | −4.2% | |
| 1880 | 14,872 | 3.3% | |
| 1890 | 16,134 | 8.5% | |
| 1900 | 16,949 | 5.1% | |
| 1910 | 19,887 | 17.3% | |
| 1920 | 20,554 | 3.4% | |
| 1930 | 18,231 | −11.3% | |
| 1940 | 18,467 | 1.3% | |
| 1950 | 18,617 | 0.8% | |
| 1960 | 17,379 | −6.6% | |
| 1970 | 16,285 | −6.3% | |
| 1980 | 17,634 | 8.3% | |
| 1990 | 18,653 | 5.8% | |
| 2000 | 17,235 | −7.6% | |
| 2010 | 17,535 | 1.7% | |
| 2020 | 16,800 | −4.2% | |
| 2023 (est.) | 17,486 | [8] | 4.1% |
| U.S. Decennial Census[9] 1790–1960[10] 1900–1990[11] 1990–2000[12] 2010–2016[13] | |||
2000 census edit
As of the 2000 census,[14] there were 17,235 people, 7,278 households, and 4,854 families residing in the county. The population density was 4 people per square mile (1.5 people/km2). There were 13,783 housing units at an average density of 4 per square mile (1.5/km2). The racial makeup of the county was 97.84% White, 0.21% Black or African American, 0.52% Native American, 0.27% Asian, 0.02% Pacific Islander, 0.14% from other races, and 1.00% from two or more races. 0.52% of the population were Hispanic or Latino of any race. 23.6% were of English, 16.4% French, 15.3% United States or American and 11.5% Irish ancestry according to Census 2000. 96.9% spoke English and 2.0% French as their first language.
There were 7,278 households, out of which 28.60% had children under the age of 18 living with them, 54.10% were married couples living together, 8.40% had a female householder with no husband present, and 33.30% were non-families. 27.80% of all households were made up of individuals, and 14.00% had someone living alone who was 65 years of age or older. The average household size was 2.34 and the average family size was 2.83.
In the county, the population was spread out, with 23.40% under the age of 18, 5.70% from 18 to 24, 26.00% from 25 to 44, 27.50% from 45 to 64, and 17.40% who were 65 years of age or older. The median age was 42 years. For every 100 females there were 96.40 males. For every 100 females age 18 and over, there were 95.20 males.
The median income for a household in the county was $28,250, and the median income for a family was $34,852. Males had a median income of $28,149 versus $20,241 for females. The per capita income for the county was $14,374. About 11.20% of families and 14.80% of the population were below the poverty line, including 17.80% of those under age 18 and 13.90% of those age 65 or over.
2010 census edit
As of the 2010 United States census, there were 17,535 people, 7,825 households, and 4,948 families residing in the county.[15] The population density was 4.4 inhabitants per square mile (1.7 inhabitants/km2). There were 15,340 housing units at an average density of 3.9 units per square mile (1.5 units/km2).[16] The racial makeup of the county was 96.9% white, 0.7% Asian, 0.5% American Indian, 0.3% black or African American, 0.3% from other races, and 1.2% from two or more races. Those of Hispanic or Latino origin made up 1.0% of the population.[15] In terms of ancestry, 21.4% were English, 16.5% were Irish, 13.6% were American, 8.7% were German, 5.5% were Scottish, and 5.3% were French Canadian.[17]
Of the 7,825 households, 23.6% had children under the age of 18 living with them, 50.1% were married couples living together, 8.5% had a female householder with no husband present, 36.8% were non-families, and 30.5% of all households were made up of individuals. The average household size was 2.21 and the average family size was 2.70. The median age was 48.1 years.[15]
The median income for a household in the county was $34,016 and the median income for a family was $43,821. Males had a median income of $34,575 versus $28,014 for females. The per capita income for the county was $19,870. About 12.3% of families and 16.2% of the population were below the poverty line, including 24.9% of those under age 18 and 12.6% of those age 65 or over.[18]
Religion edit
Piscataquis County has one of the lowest rates of religious adherence in the United States. The county ranks at 3,085 of 3,148 counties (lowest 2%), with 20.5% of the population regularly attending congregations or claiming religious membership.[19]
In Maine, Piscataquis County ranks tenth of the 16 counties in percentage of religious adherents. The State of Maine has the lowest percentage of religious adherents in the United States at 27%.[19][20]
Government and politics edit
This section needs to be updated. (February 2019) |
County officials edit
The following individuals hold county offices:[21]
- Interim County Manager: Tom Lizotte
- County Treasurer: Johanna Greenfield
- Mayor: Paul Paydos
- Finance Administrator: Kathy Walsh
- Sheriff: Robert Young
- EMA Director: Tom Capraro
- Probate Register: Donna Peterson
- Deeds Register: Linda Smith
- District Attorney: R. Chris Almy
- DA Administrative Assistant: Corinna Rackliff
- Head of Maintenance: Josh York
- Judge of Probate: James R. Austin
County Commissioners and Districts edit
Piscataquis County is administered by three County Commissioners, each representing one of the three county districts. They are elected for four-year terms. A term of office begins on January 1 following the election in November. County Commissioner meetings are typically held on the 1st and 3rd Tuesdays of the month at the County Courthouse in Dover-Foxcroft. The meetings begin at 8:30 a.m. and continue until the agenda for the meeting has been addressed.
County Commissioners:
District 1:Eric P. Ward
District 2:James D. Annis
District 3:Frederick Trask
County Districts:
District 1 includes the towns of Abbot, Beaver Cove, Greenville, Guilford, Kingsbury Plt, Monson, Parkman, Shirley, Wellington and the Unorganized Territories of Blanchard, Elliotsville and Northwest Piscataquis.
District 2 includes the towns of Dover-Foxcroft, Sangerville and Willimantic.
District 3 includes the towns of Bowerbank, Brownville, Lake View Plt, Medford, Milo, Sebec and the Unorganized Territories of Atkinson, Barnard, Ebeeme, Katahdin Iron Works, Orneville, Williamsburg and Northeast Piscataquis County.[22]
Voter registration edit
| Voter registration and party enrollment as of March 2024[23] | |||||
|---|---|---|---|---|---|
| Republican | 4,884 | 42.18% | |||
| Unenrolled | 3,330 | 28.76% | |||
| Democratic | 2,545 | 21.98% | |||
| Green Independent | 466 | 4.02% | |||
| No Labels | 313 | 2.7% | |||
| Libertarian | 42 | 0.36% | |||
| Total | 11,580 | 100% | |||
Elections edit
County Commissioner edit
In the 2012 Piscataquis County Commissioner District 2 election, Republican candidate James Annis received 52% of the vote. Democratic candidate Susan Mackey-Andrews received 48%. In the District 3 election, Republican incumbent Frederick Trask received 50.2% (1,282 votes) and Democratic candidate Donald Crossman received 49.8% (1,271 votes) – a difference of 11 votes, confirmed after a recount.[24]
| Year | REP | DEM | IND | Other | Winner | District # |
|---|---|---|---|---|---|---|
| 2012 | 52.0% 1,496 | 48.0% 1,378 | - - | - - | James Annis | 2 |
| 2012 | 50.2% 1,282 | 49.8% 1,271 | - - | - - | Frederick Trask | 3 |
Governor edit
In the Maine gubernatorial election, 2010, Republican candidate Paul LePage received the most votes in Piscataquis County with 48.4%. Three Independent candidates ran in this election: Eliot Cutler received the second most Piscatquis votes with 36.5% of the total, Shawn Moody received 3.1% and Kevin Scott, 1%. Democratic candidate, Libby Mitchell received the third most votes in the county with 10.9% of the total. Paul LePage was elected governor.
In the Maine gubernatorial election, 2006, Republican candidate Chandler Woodcock received the most votes in Piscataquis County with 37.7%. Democratic candidate, incumbent governor John Baldacci received 34.5%. Independent candidate Barbara Merrill received 19.7%, Green party candidate Pat LaMarche received 7.4%, and Phillip Morris NaPier received .63% of the Piscataquis vote. John Baldacci was reelected governor.
In the Maine gubernatorial election, 2002, Democratic candidate John Baldacci received the most votes in Piscataquis County with 50.4%. Republican candidate Peter Cianchette received 42.9% of the county vote and Green Party candidate, Jonathan Carter received 5.1%. John Baldacci was elected governor.
In the Maine gubernatorial election, 1998, Independent candidate Angus King received the most votes in Piscataquis County with 50.2%. Republican candidate James Longley, Jr. received 26.6%, Democratic candidate Tom Connolly received 10.7%. Other candidates split 12.5% of the vote. Angus King was elected governor.
| Year | REP | DEM | IND | Other | Winner |
|---|---|---|---|---|---|
| 2018 | 55.0% 4,075 | 38.7% 2,868 | 6.3% 463 | - - | Shawn Moody |
| 2014 | 57.9% 4,736 | 34.4% 2,810 | 7.7% 631 | .0% 2 | Paul LePage |
| 2010 | 48.4% 3,724 | 10.9% 837 | 40.6% 3,124 | .1% 1 | Paul LePage |
| 2006 | 37.7% 2,829 | 34.5% 2,591 | 19.7% 1,476 | 8.1% 606 | Chandler Woodcock |
| 2002 | 42.9% 3,045 | 50.4% 3,583 | - - | 5.1% 362 | John Baldacci |
| 1998 | 26.6% 1,752 | 10.7% 708 | 50.2% 3,313 | 12.5% 824 | Angus King |
| 1994 | 34.7% 2,649 | 28.9% 2,206 | 27.9% 2,131 | 8.6% 655 | Susan Collins |
| 1990 | 51.1% 4,177 | 39.3% 3,213 | 9.6% 783 | 0% 4 | John McKernan |
US House edit
Piscataquis County is entirely within Maine's 2nd congressional district, which comprises 80% of the state and is the largest district by land area east of the Mississippi River.
In the United States House of Representatives elections in Maine, 2012, incumbent Democratic candidate Michael Michaud received the most Piscataquis County votes with 53% of the total. Republican candidate, Kevin Raye received 47%. Michael Michaud was reelected to the House.
| Year | REP | DEM | IND | Other | Winner |
|---|---|---|---|---|---|
| 2020 | 54.9% 5,483 | 44.9% 4,338 | - - | 175 .2% | Dale Crafts |
| 2012 | 47.0% 4,150 | 53.0% 4,673 | - - | - - | Michael Michaud |
US Senate edit
In the United States Senate election in Maine, 2012, Independent candidate and former Maine governor, Angus King received the most votes in Piscataquis County with 45.7% of the vote. Republican candidate, Charlie Summers received 40.1% and Democratic candidate Cynthia Dill received 10.4%. Stephen M. Woods received 136 votes, Andrew I. Dodge received 126 votes and Danny F. Dalton, 76 votes. Angus King was elected to the Senate.
| Year | REP | DEM | IND | Other | Winner |
|---|---|---|---|---|---|
| 2020 | 67.0% 6,603 | 26.9% 2,655 | 6.1% 504 | - - | Susan Collins |
| 2018 | 47.8% 3,579 | 7.1% 534 | 45.1% 3,379 | .0% 4 | Eric Brakey |
| 2014 | 76.8% 6,174 | 23.1% 1,862 | - - | .1% 6 | Susan Collins |
| 2012 | 40.1% 3,522 | 10.4% 911 | 45.7% 4,016 | 3.8% 338 | Angus King |
| 2008 | 69.1% 6,494 | 30.8% 2,896 | -- | 0% 4 | Susan Collins |
| 2006 | 75.4% 5,564 | 16.9% 1,244 | 7.6% 558 | .1% 10 | Olympia Snowe |
| 2002 | 65.3% 4,633 | 34.7% 2,459 | -- | - - | Susan Collins |
| 2000 | 71.9% 6,428 | 28.1% 2,510 | -- | - - | Olympia Snowe |
| 1996 | 56.3% 5,057 | 38.2% 3,429 | -- | 5.5% 494 | Susan Collins |
| 1994 | 69.9% 5,313 | 26.8% 2,037 | 3.2% 245 | .1% 9 | Olympia Snowe |
| 1990 | 66.0% 5,222 | 34.0% 2,686 | - - | - - | William Cohen |
President edit
In the 2012 United States presidential election, Republican candidate Mitt Romney received the most votes in Piscataquis County with 50.6%. Democratic incumbent Barack Obama received 46.3%. Libertarian candidate Gary Johnson received 1.5% and Green Independent candidate Jill Stein received 1.24%. There were a total of 30 "write in" votes; 29 of these were for Ron Paul and 1 for Rocky Anderson. Barack Obama was reelected President.[25][26]
Since 2000, Piscataquis County has generally been the most reliably Republican county in Maine, and New England. In 2008, Piscataquis was the only county in New England to vote for John McCain, by a margin of 355 votes or 3.8%[27] over Barack Obama, with Obama winning Maine by a 17.3% margin over McCain.[28] In 2012, Piscataquis was only one of 5 counties in New England to support Republican candidate Mitt Romney.[29] Republican candidate Donald Trump carried the county in 2016 while greatly improving on Romney's performance. He won it again in 2020 with 62% of the vote, marking the first time a Republican presidential candidate won Piscataquis County with over 60% of the vote since Ronald Reagan in 1984.
In 2004, the county was one of only two in Maine to vote for Bush over John Kerry. Bush won by a 9% margin over Kerry, with Kerry winning the state by a virtually even margin over Bush.[30]
In the 2000 U.S. presidential election, George W. Bush carried the county by an 11.9% margin over Al Gore, with Gore carrying the state by a 5.1% margin over Bush.
In 1996, Bill Clinton carried the county with 48.7% of the vote, the first Democrat to do so since 1968.[31]
In the 1992 presidential election, independent Ross Perot won a plurality 36.8% in the county, one of three counties he won in the state.[32]
| Year | Republican | Democratic | Third party | |||
|---|---|---|---|---|---|---|
| No. | % | No. | % | No. | % | |
| 2020 | 6,143 | 62.00% | 3,517 | 35.50% | 248 | 2.50% |
| 2016 | 5,406 | 58.88% | 3,098 | 33.74% | 678 | 7.38% |
| 2012 | 4,530 | 50.59% | 4,149 | 46.33% | 276 | 3.08% |
| 2008 | 4,785 | 50.72% | 4,430 | 46.96% | 219 | 2.32% |
| 2004 | 5,299 | 53.31% | 4,409 | 44.36% | 232 | 2.33% |
| 2000 | 4,845 | 52.34% | 3,745 | 40.46% | 666 | 7.20% |
| 1996 | 2,815 | 31.56% | 4,343 | 48.69% | 1,762 | 19.75% |
| 1992 | 2,970 | 29.61% | 3,323 | 33.13% | 3,738 | 37.26% |
| 1988 | 4,788 | 58.27% | 3,323 | 40.44% | 106 | 1.29% |
| 1984 | 5,427 | 63.98% | 3,016 | 35.56% | 39 | 0.46% |
| 1980 | 4,015 | 46.93% | 3,550 | 41.50% | 990 | 11.57% |
| 1976 | 4,084 | 50.48% | 3,727 | 46.07% | 279 | 3.45% |
| 1972 | 4,617 | 64.70% | 2,518 | 35.29% | 1 | 0.01% |
| 1968 | 3,199 | 46.24% | 3,561 | 51.47% | 158 | 2.28% |
| 1964 | 2,473 | 34.06% | 4,781 | 65.84% | 7 | 0.10% |
| 1960 | 4,959 | 63.43% | 2,859 | 36.57% | 0 | 0.00% |
| 1956 | 5,336 | 77.59% | 1,541 | 22.41% | 0 | 0.00% |
| 1952 | 4,652 | 67.20% | 2,261 | 32.66% | 10 | 0.14% |
| 1948 | 3,227 | 59.34% | 2,181 | 40.11% | 30 | 0.55% |
| 1944 | 3,536 | 54.45% | 2,957 | 45.53% | 1 | 0.02% |
| 1940 | 3,806 | 52.05% | 3,499 | 47.85% | 7 | 0.10% |
| 1936 | 4,057 | 55.61% | 3,051 | 41.82% | 187 | 2.56% |
| 1932 | 4,198 | 59.14% | 2,849 | 40.13% | 52 | 0.73% |
| 1928 | 4,792 | 77.78% | 1,353 | 21.96% | 16 | 0.26% |
| 1924 | 4,031 | 75.94% | 974 | 18.35% | 303 | 5.71% |
| 1920 | 4,049 | 68.79% | 1,788 | 30.38% | 49 | 0.83% |
| 1916 | 2,142 | 54.16% | 1,763 | 44.58% | 50 | 1.26% |
| 1912 | 807 | 21.41% | 1,210 | 32.10% | 1,753 | 46.50% |
| 1908 | 2,157 | 70.49% | 828 | 27.06% | 75 | 2.45% |
| 1904 | 2,043 | 74.51% | 616 | 22.47% | 83 | 3.03% |
| 1900 | 2,023 | 67.50% | 824 | 27.49% | 150 | 5.01% |
| 1896 | 2,342 | 70.37% | 904 | 27.16% | 82 | 2.46% |
| 1892 | 1,909 | 58.02% | 1,249 | 37.96% | 132 | 4.01% |
| 1888 | 2,091 | 60.35% | 1,297 | 37.43% | 77 | 2.22% |
| 1884 | 1,976 | 58.02% | 1,169 | 34.32% | 261 | 7.66% |
| 1880 | 1,943 | 56.83% | 1,330 | 38.90% | 146 | 4.27% |
Communities edit
Towns edit
Plantations edit
Census-designated places edit
Survey Townships edit
Unorganized territories edit
Notable people edit
- Berenice Abbott, photographer
- David Mallett, singer-songwriter
- Sir Hiram Stevens Maxim, inventor
- Sir Harry Oakes, philanthropist
- Roxanne Quimby, businesswoman
- Max Schubel, composer
- Oswald Tippo, botanist
See also edit
Notes edit
- ^ The others are Lake County and Cook County in Minnesota, Ontonagon County and Keweenaw County in Michigan, Issaquena County in Mississippi, and Highland County in Virginia
References edit
- ^ "Census - Geography Profile: Piscataquis County, Maine". United States Census Bureau. Retrieved November 21, 2021.
- ^ "Find a County". National Association of Counties. Archived from the original on May 31, 2011. Retrieved June 7, 2011.
- ^ source: US Census Bureau. "Frontier Counties of the United States 2010 (archived)". Rural Health Information Hub. Retrieved February 15, 2018.
- ^ “PLANT PROFILE: Charles Horne Sr. Pollution Control Facility.” Water Environment & Technology 15, no. 6 (2003): 60–60. http://www.jstor.org/stable/24670431.
- ^ Palmquist, Ron. Railroad History, no. 182 (2000): 111–12. http://www.jstor.org/stable/43522228.
- ^ Acheson, James M. “Maine: On the Cusp of the Forest Transition.” Human Organization 67, no. 2 (2008): 125–36. http://www.jstor.org/stable/44127091.
- ^ "2010 Census Gazetteer Files". United States Census Bureau. August 22, 2012. Archived from the original on September 9, 2014. Retrieved September 7, 2014.
- ^ "Annual Estimates of the Resident Population for Counties: April 1, 2020 to July 1, 2023". United States Census Bureau. Retrieved April 3, 2024.
- ^ "U.S. Decennial Census". United States Census Bureau. Retrieved September 7, 2014.
- ^ "Historical Census Browser". University of Virginia Library. Retrieved September 7, 2014.
- ^ "Population of Counties by Decennial Census: 1900 to 1990". United States Census Bureau. Retrieved September 7, 2014.
- ^ "Census 2000 PHC-T-4. Ranking Tables for Counties: 1990 and 2000" (PDF). United States Census Bureau. Archived (PDF) from the original on March 27, 2010. Retrieved September 7, 2014.
- ^ "State & County QuickFacts". United States Census Bureau. Archived from the original on June 6, 2011. Retrieved August 19, 2013.
- ^ "U.S. Census website". United States Census Bureau. Retrieved January 31, 2008.
- ^ a b c "DP-1 Profile of General Population and Housing Characteristics: 2010 Demographic Profile Data". United States Census Bureau. Archived from the original on February 13, 2020. Retrieved January 21, 2016.
- ^ "Population, Housing Units, Area, and Density: 2010 - County". United States Census Bureau. Archived from the original on February 13, 2020. Retrieved January 21, 2016.
- ^ "DP02 SELECTED SOCIAL CHARACTERISTICS IN THE UNITED STATES – 2006-2010 American Community Survey 5-Year Estimates". United States Census Bureau. Archived from the original on February 13, 2020. Retrieved January 21, 2016.
- ^ "DP03 SELECTED ECONOMIC CHARACTERISTICS – 2006-2010 American Community Survey 5-Year Estimates". United States Census Bureau. Archived from the original on February 13, 2020. Retrieved January 21, 2016.
- ^ a b "Archived copy". Archived from the original on July 29, 2015. Retrieved January 18, 2013.
{{cite web}}: CS1 maint: archived copy as title (link) - ^ "PHOTOS: Most And Least Christian States In America". Huffington Post. May 29, 2012.
- ^ "Piscataquis County Commissioners". www.piscataquis.us.
- ^ "Archived copy". Archived from the original on January 21, 2020. Retrieved January 14, 2013.
{{cite web}}: CS1 maint: archived copy as title (link) - ^ Bureau of Corporations, Elections & Commissions. "Registered & Enrolled Voters Statewide" (PDF). Maine SOS. Retrieved April 9, 2024.
- ^ "Trask prevails by 11 votes in Piscataquis county commissioner recount". November 26, 2012.
- ^ "Dave Leip's Atlas of U.S. Presidential Elections". uselectionatlas.org.
- ^ "Bureau of Corporations, Elections & Commissions, Elections Division". Archived from the original on August 1, 2012.
- ^ "November 4, 2008 General Election Tabulations (US President by County)". Archived from the original on August 25, 2009. Retrieved July 4, 2009.
- ^ 2008 Presidential General Election Results. U.S. Election Atlas. Retrieved 2010-08-02.
- ^ "Piscataquis keeps red reputation as only Maine county to back Romney". November 7, 2012.
- ^ 2004 Presidential General Election Data Graphs – Maine. U.S. Election Atlas. Retrieved 2010-08-02.
- ^ 1996 Presidential General Election Data Graphs – Maine. U.S. Election Atlas. Retrieved 2010-08-02.
- ^ 1992 Presidential General Election Data Graphs – Maine. U.S. Election Atlas. Retrieved 2010-08-02.
- ^ Leip, David. "Dave Leip's Atlas of U.S. Presidential Elections". uselectionatlas.org. Retrieved August 26, 2018.
External links edit
- Official website of Piscataquis County
- History of Piscataquis County, Maine: From Its Earliest Settlement to 1880. By Amasa Loring. Published 1880.
- Piscataquis County Economic Development Council
- Piscataquis Chamber of Commerce
- Moosehead Lake Region Chamber of Commerce
- Three Rivers Community Alliance
- University of Maine Cooperative Extension Piscataquis County Office