
Size of this preview: 800 × 507 pixels. Other resolutions: 320 × 203 pixels | 640 × 405 pixels | 1,024 × 649 pixels | 1,280 × 811 pixels | 3,000 × 1,900 pixels.
Original file (3,000 × 1,900 pixels, file size: 1.46 MB, MIME type: image/png)
| This is a file from the Wikimedia Commons. Information from its description page there is shown below. Commons is a freely licensed media file repository. You can help. |
Summary
| Description |
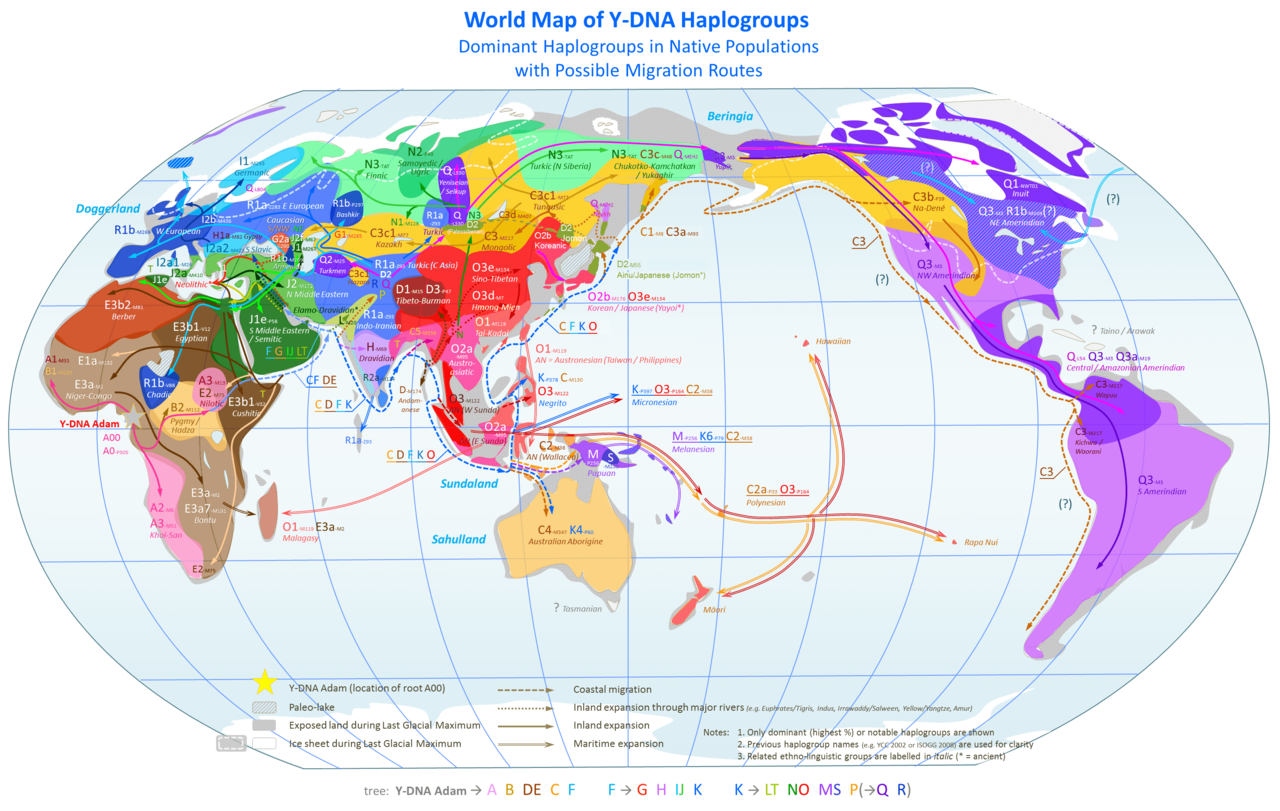
English: World Map of Y-Chromosome Haplogroups - Dominant Haplogroups in Pre-Colonial Populations with Possible Migrations Routes
Notes:
Inspired by Português: Mapa-múndi dos haplogrupos do cromossoma Y: Haplogrupos dominantes nas populações pré-coloniais com as possíveis rotas migratórias.
Notas:
|
| Date | |
| Source |
Own work based on: |
| Author | Chakazul |
.PNG)
.PNG)
.PNG)
.PNG)
.PNG)
.PNG)
.PNG&action=edit&redlink=1)
.PNG)
.PNG)
.PNG)

|
This biogeographical map image could be re-created using vector graphics as an SVG file. This has several advantages; see Commons:Media for cleanup for more information. If an SVG form of this image is available, please upload it and afterwards replace this template with
{{vector version available|new image name}}.
It is recommended to name the SVG file “World Map of Y-DNA Haplogroups.svg”—then the template Vector version available (or Vva) does not need the new image name parameter. |
Licensing
I, the copyright holder of this work, hereby publish it under the following licenses:

|
Permission is granted to copy, distribute and/or modify this document under the terms of the GNU Free Documentation License, Version 1.2 or any later version published by the Free Software Foundation; with no Invariant Sections, no Front-Cover Texts, and no Back-Cover Texts. A copy of the license is included in the section entitled GNU Free Documentation License. |
This file is licensed under the Creative Commons Attribution-Share Alike 3.0 Unported license.
- You are free:
- to share – to copy, distribute and transmit the work
- to remix – to adapt the work
- Under the following conditions:
- attribution – You must give appropriate credit, provide a link to the license, and indicate if changes were made. You may do so in any reasonable manner, but not in any way that suggests the licensor endorses you or your use.
- share alike – If you remix, transform, or build upon the material, you must distribute your contributions under the same or compatible license as the original.
You may select the license of your choice.
File history
Click on a date/time to view the file as it appeared at that time.
| Date/Time | Thumbnail | Dimensions | User | Comment | |
|---|---|---|---|---|---|
| current | 05:55, 28 March 2019 | | 3,000 × 1,900 (1.46 MB) | Mann Mann | SibirHusky is an obvious sockpuppet of https://en.wikipedia.org/wiki/Wikipedia:Long-term_abuse/Tirgil34 |
| 22:18, 7 January 2019 |  | 3,000 × 1,900 (1.52 MB) | SibirHusky | see Peter Underhill map; https://www.nature.com/articles/ejhg201450/figures/3 | |
| 22:51, 15 October 2018 |  | 3,000 × 1,900 (1.46 MB) | Chiorbone da Frittole | Fix. also in south Italy R1b is 27.5 vs J2 21.5 | |
| 18:49, 25 July 2018 |  | 3,000 × 1,900 (1.52 MB) | Satoshi Kondo | some other minor fixes, greece is actually J2(38%) E(35%); D2 fix in kyushu; colour fix | |
| 19:39, 18 July 2018 |  | 3,000 × 1,900 (1.53 MB) | Satoshi Kondo | minor update about y-DNA D2-M55 and own colour as edit for O2b, migration path fix and distribution, i also show the amount of D2 found in siberian/central-asian tuvan/altaian/kyrgyz/mongolic paleosiberians that are another proove of the northern migration of D2. source: 崎谷満(2009)『DNA・考古・言語の学際研究が示す新・日本列島史 日本人集団・日本語の成立史』勉誠出版 | |
| 13:41, 13 July 2018 |  | 3,000 × 1,900 (1.53 MB) | Satoshi Kondo | the revise you ask for. I created own O2b colour (dark pink) to show difference from O2a. I also included the descedants of goguryeo (and today manchu) who have a high amount of O2b. I changed the Hmong-Mien orange to red as they are a sub-group of O3 and relative close to han. I show the northern viet-O3 and kra-dai O2a in southern china. I show the han in taiwan as O3 on west side. I also included Jeju island to the map. I hope this is ok, if you have other ideas how we can change/fix the m... | |
| 22:24, 9 July 2018 |  | 3,000 × 1,900 (1.53 MB) | Irish1028 | As you said, if the South China is the origin of Y-DNA O2b gene(that is, Yayoi; is the mainstream ethnicity both Korea and Japan), isn't it necessary to supplement?(for example, paint pink to South China). Also, As you can see the text O2b and O2a, the two show significant differences in DNA configuration. So if there is no 02(pink) painting in the South China, they seem to be difficult to understand. Can you make a supplementary revise? | |
| 21:11, 7 July 2018 |  | 3,000 × 1,900 (498 KB) | Satoshi Kondo | Reverted to version as of 17:33, 7 July 2018 (UTC)THE MAP SHOW THE MAJOR HAPLOGROUP!!!!! ARE YOU NOT ABLE TO READ ENGLISH SENTENCE!? O2B IS 40% O3 ONLY 20% IN HONSHU!!!!! WHAT IS WRONG!? | |
| 21:05, 7 July 2018 |  | 3,000 × 1,900 (1.53 MB) | Irish1028 | appropriate version about japan. admixture of O2b and O3. You stubborn man! Say what you think in discussion. Don't talk here. | |
| 17:33, 7 July 2018 |  | 3,000 × 1,900 (498 KB) | Satoshi Kondo | Reverted to version as of 15:08, 6 July 2018 (UTC) what you think is not relevant. you are doing POV vandalism. the map CLEALY say MAJOR haplogroups. not minor. this has nothing to do with race. finns have y-DNA N but look predominant nordic and not mongolid. so stop your vandalism. |
File usage
The following pages on the English Wikipedia use this file (pages on other projects are not listed):
Global file usage
The following other wikis use this file:
- Usage on ar.wikipedia.org
- Usage on bg.wikipedia.org
- Usage on bn.wikipedia.org
- Usage on ckb.wikipedia.org
- Usage on cs.wikipedia.org
- Usage on da.wikipedia.org
- Usage on de.wikipedia.org
- Usage on fa.wikipedia.org
- Usage on fi.wikipedia.org
- Usage on fr.wikipedia.org
- Usage on he.wikipedia.org
- Usage on hy.wikipedia.org
- Usage on id.wikipedia.org
- Usage on it.wikipedia.org
- Usage on ja.wikipedia.org
- Usage on ka.wikipedia.org
- Usage on ko.wikipedia.org
- Usage on lv.wikipedia.org
- Usage on mk.wikipedia.org
- Usage on mn.wikipedia.org
- Usage on nl.wikipedia.org
- Usage on no.wikipedia.org
- Usage on pl.wikipedia.org
- Usage on pt.wikipedia.org
View more global usage of this file.