
Size of this preview: 800 × 492 pixels. Other resolutions: 320 × 197 pixels | 640 × 393 pixels | 965 × 593 pixels.
Original file (965 × 593 pixels, file size: 108 KB, MIME type: image/jpeg)
| This is a file from the Wikimedia Commons. Information from its description page there is shown below. Commons is a freely licensed media file repository. You can help. |
Summary
| Description |
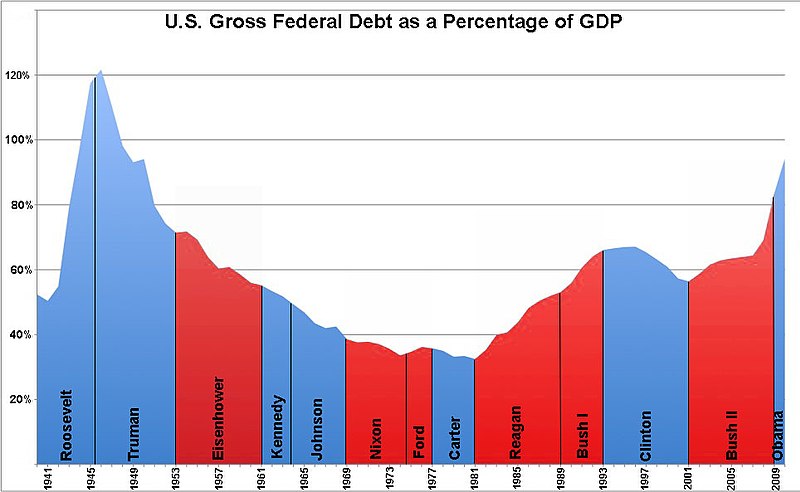
English: This is a graph of U.S. gross federal government debt from 1940 to 2010, as a percentage of GDP, broken down by presidential terms. The data is from the U.S. Office of Management and Budget (http://www.whitehouse.gov/sites/default/files/omb/budget/fy2011/assets/hist07z1.xls).
Replaced by File:US_Federal_Debt_as_Percent_of_GDP_by_President.png |
| Date | |
| Source | Own work |
| Author | CircleAdrian & Michael Adams |
| Other versions | US_Federal_Debt_as_Percent_of_GDP_by_President.png |

|
File:US Federal Debt as Percent of GDP by President.svg is a vector version of this file. It should be used in place of this JPG file when not inferior.
File:US Federal Debt as Percent of GDP by President.jpg → File:US Federal Debt as Percent of GDP by President.svg
For more information, see Help:SVG. |
 |
Licensing
| I, the copyright holder of this work, release this work into the public domain. This applies worldwide. In some countries this may not be legally possible; if so: I grant anyone the right to use this work for any purpose, without any conditions, unless such conditions are required by law. |
File history
Click on a date/time to view the file as it appeared at that time.
| Date/Time | Thumbnail | Dimensions | User | Comment | |
|---|---|---|---|---|---|
| current | 05:08, 18 January 2011 | | 965 × 593 (108 KB) | ResidentScholar~commonswiki | Reverted to version as of 06:04, 7 April 2010 |
| 10:57, 16 January 2011 |  | 965 × 593 (75 KB) | ResidentScholar~commonswiki | Corrected Bush and Obama figures. Fiscal years and calendar years may be intermixed elsewhere so further revision may be necessary. In this case 69.5% of GDP is the end-of-Fiscal-year debt figure used by the OMB source; I used 74.5% which is the end-of- | |
| 06:04, 7 April 2010 |  | 965 × 593 (108 KB) | CircleAdrian | Increased proportional size of Y-axis, color-coded by presidential term, and took off estimates for dates after 2010 (due to potential inaccuracy). | |
| 09:29, 1 April 2010 | 1,405 × 485 (167 KB) | Unquietwiki | This is a graph of U.S. federal government debt from 1940 to 2015, as a percentage of GDP, broken down by year+President. The data is from the U.S. Office of Management and Budget (http://www.whitehouse.gov/omb/budget/fy2011/assets/hist07z1.xls) [[Catego | ||
| 03:14, 31 March 2010 |  | 856 × 481 (77 KB) | CircleAdrian | {{Information |Description={{en|1=This is a graph of U.S. federal government debt from 1977 to 2009, as a percentage of GDP, broken down by presidential terms. The data is from the U.S. Office of Management and Budget (http://www.whitehouse.gov/omb/budget |
File usage
The following pages on the English Wikipedia use this file (pages on other projects are not listed):
Global file usage
The following other wikis use this file:
- Usage on de.wikipedia.org
- Usage on no.wikipedia.org