
Original file (SVG file, nominally 576 × 432 pixels, file size: 97 KB)
| This is a file from the Wikimedia Commons. Information from its description page there is shown below. Commons is a freely licensed media file repository. You can help. |
Summary
| Description |
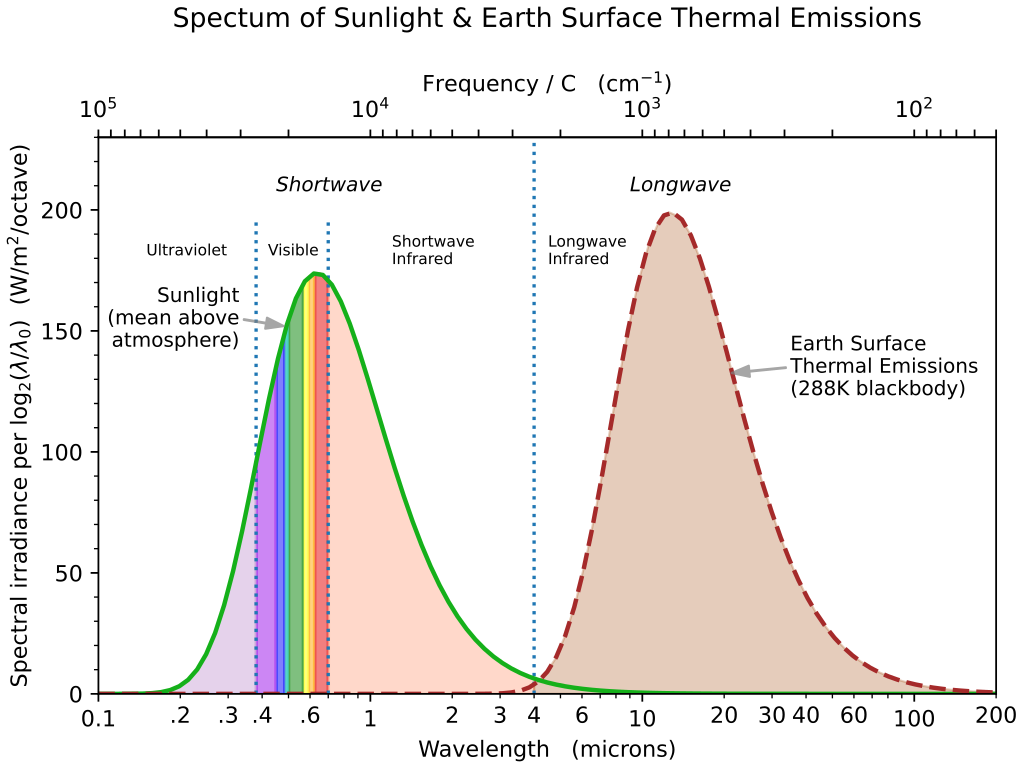
English: Figure shows spectrums of sunlight and radiation emitted by Earth's surface. Sunlight is taken as the radiation of a blackbody at 5772K but with an overall intensity scaled to match the 340 W/m2 overall average solar irradiance above Earth's atmosphere. Emissions from Earth's surface are taken to be those of a blackbody at a temperature of 288K/15℃.
Planck's Law is used to calculate the blackbody curves, but a form is used that is appropriate for use with a logarithmic X-axis. This involves multiplying the wavelength version by 𝜆⋅log(2) where 𝜆 is wavelength, or by starting with the frequency version of Planck’s Law and multiplying it by 𝜈⋅log(2) where 𝜈 is frequency. This correctly yields a diagram in which the area under the curve corresponds to the total power. The power is power per doubling of wavelength or frequency. Many similar diagrams simply use the wavelength or frequency version of Planck's Law while using a logarithmic X-axis, and arbitrarily rescale the two curves to be of comparable size. Such diagrams do not allow the two spectra to be compared accurately, and do not have the property of area under the curve corresponding to total intensity. The diagram distinguishes different regions of the electromagnetic spectrum, separating shortwave and longwave radiation with the commonly-used cutoff of 4 microns. |
| Date | |
| Source | Own work |
| Author | Rhwentworth |
Licensing
- You are free:
- to share – to copy, distribute and transmit the work
- to remix – to adapt the work
- Under the following conditions:
- attribution – You must give appropriate credit, provide a link to the license, and indicate if changes were made. You may do so in any reasonable manner, but not in any way that suggests the licensor endorses you or your use.
- share alike – If you remix, transform, or build upon the material, you must distribute your contributions under the same or compatible license as the original.
File history
Click on a date/time to view the file as it appeared at that time.
| Date/Time | Thumbnail | Dimensions | User | Comment | |
|---|---|---|---|---|---|
| current | 17:01, 24 April 2023 | | 576 × 432 (97 KB) | Rhwentworth | Uploaded own work with UploadWizard |