
Size of this PNG preview of this SVG file: 800 × 495 pixels. Other resolutions: 320 × 198 pixels | 640 × 396 pixels | 1,024 × 634 pixels | 1,280 × 792 pixels | 2,560 × 1,585 pixels | 1,000 × 619 pixels.
Original file (Animated SVG file, nominally 1,000 × 619 pixels, file size: 2.24 MB)
Note: Due to technical limitations, thumbnails of this file will not be animated.
| This is a file from the Wikimedia Commons. Information from its description page there is shown below. Commons is a freely licensed media file repository. You can help. |

|
This image is an animated SVG file. The .png preview above created by RSVG for use in Wikimedia is not animated and may be incomplete or incorrect. To see the animation, open media:Massachusetts municipal population flows.svg. It should run in any modern browser or viewer. Recent versions of Chrome, Firefox, Microsoft Edge, Safari, and Opera all support SVG animated with SMIL.
Other SVG animations can be found at Category:Animated SVG files.
|
Summary
| Description |
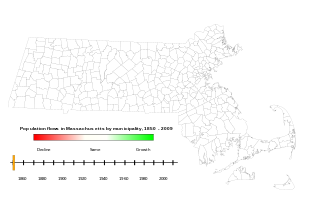
English: Animation showing population changes for all towns and cities in Massachusetts for each decade between 1850 and 2009. |
| Date | |
| Source | Underlying population counts gathered from decennial US Census records. SVG paths of municipalities derived from MA cities towns.svg by Sswonk. |
| Author | Emw |
| SVG development |
Licensing
I, the copyright holder of this work, hereby publish it under the following licenses:

|
Permission is granted to copy, distribute and/or modify this document under the terms of the GNU Free Documentation License, Version 1.2 or any later version published by the Free Software Foundation; with no Invariant Sections, no Front-Cover Texts, and no Back-Cover Texts. A copy of the license is included in the section entitled GNU Free Documentation License. |
This file is licensed under the Creative Commons Attribution-Share Alike 3.0 Unported, 2.5 Generic, 2.0 Generic and 1.0 Generic license.
- You are free:
- to share – to copy, distribute and transmit the work
- to remix – to adapt the work
- Under the following conditions:
- attribution – You must give appropriate credit, provide a link to the license, and indicate if changes were made. You may do so in any reasonable manner, but not in any way that suggests the licensor endorses you or your use.
- share alike – If you remix, transform, or build upon the material, you must distribute your contributions under the same or compatible license as the original.
You may select the license of your choice.
File history
Click on a date/time to view the file as it appeared at that time.
| Date/Time | Thumbnail | Dimensions | User | Comment | |
|---|---|---|---|---|---|
| current | 16:12, 26 February 2011 | | 1,000 × 619 (2.24 MB) | Emw | {{Information |Description ={{en|1=Animation showing population changes for all towns and cities in Massachusetts for each decade between 1850 and 2009. Underlying population counts gathered from US Census records.}} |Source ={{own}} |Author |
File usage
The following pages on the English Wikipedia use this file (pages on other projects are not listed):
Global file usage
The following other wikis use this file:
- Usage on fr.wikipedia.org