 |
|---|
| Party | Votes | % | Seats | +/– |
|---|
| Denmark proper |
|---|
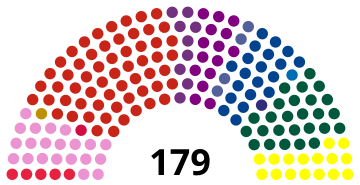
| Social Democrats | 1,026,726 | 32.87 | 59 | –9 |
| Conservative People's Party | 451,478 | 14.45 | 26 | +4 |
| Socialist People's Party | 353,373 | 11.31 | 21 | +10 |
| Venstre | 353,280 | 11.31 | 20 | –2 |
| Progress Party | 278,383 | 8.91 | 16 | –4 |
| Centre Democrats | 258,522 | 8.28 | 15 | +9 |
| Danish Social Liberal Party | 160,053 | 5.12 | 9 | –1 |
| Left Socialists | 82,711 | 2.65 | 5 | –1 |
| Christian People's Party | 72,174 | 2.31 | 4 | –1 |
| Justice Party of Denmark | 45,174 | 1.45 | 0 | –5 |
| Communist Party of Denmark | 34,625 | 1.11 | 0 | 0 |
| Communist Workers Party | 4,223 | 0.14 | 0 | 0 |
| Socialist Workers Party | 2,034 | 0.07 | 0 | New |
| Independents | 807 | 0.03 | 0 | 0 |
| Total | 3,123,563 | 100.00 | 175 | 0 |
|
| Valid votes | 3,123,563 | 99.37 | |
|---|
| Invalid/blank votes | 19,881 | 0.63 | |
|---|
| Total votes | 3,143,444 | 100.00 | |
|---|
| Registered voters/turnout | 3,775,333 | 83.26 | |
|---|
| Faroe Islands |
|---|
| Union Party | 4,393 | 26.44 | 1 | 0 |
| Social Democratic Party | 4,070 | 24.49 | 1 | 0 |
| Republican Party | 3,441 | 20.71 | 0 | 0 |
| People's Party | 3,073 | 18.49 | 0 | 0 |
| Self-Government | 867 | 5.22 | 0 | 0 |
| Progress and Fisheries Party | 773 | 4.65 | 0 | 0 |
| Total | 16,617 | 100.00 | 2 | 0 |
|
| Valid votes | 16,617 | 99.53 | |
|---|
| Invalid/blank votes | 79 | 0.47 | |
|---|
| Total votes | 16,696 | 100.00 | |
|---|
| Registered voters/turnout | 30,127 | 55.42 | |
|---|
| Greenland |
|---|
| Atassut | 9,223 | 48.86 | 1 | 0 |
| Siumut | 7,126 | 37.75 | 1 | 0 |
| Independents | 2,529 | 13.40 | 0 | New |
| Total | 18,878 | 100.00 | 2 | 0 |
|
| Valid votes | 18,878 | 95.33 | |
|---|
| Invalid/blank votes | 925 | 4.67 | |
|---|
| Total votes | 19,803 | 100.00 | |
|---|
| Registered voters/turnout | 32,466 | 61.00 | |
|---|
| Source: Nohlen & Stöver |
References
edit


