Cumlosen is a municipality in the Prignitz district, in Brandenburg, Germany.
Cumlosen | |
|---|---|
Location of Cumlosen within Prignitz district  | |
 Cumlosen  Cumlosen | |
| Coordinates: 53°01′59″N 11°40′00″E / 53.03306°N 11.66667°E | |
| Country | Germany |
| State | Brandenburg |
| District | Prignitz |
| Municipal assoc. | Lenzen-Elbtalaue |
| Subdivisions | 3 Ortsteile |
| Government | |
| • Mayor (2019–24) | Harald Pohle[1] |
| Area | |
| • Total | 21.85 km2 (8.44 sq mi) |
| Elevation | 20 m (70 ft) |
| Population (2022-12-31)[2] | |
| • Total | 719 |
| • Density | 33/km2 (85/sq mi) |
| Time zone | UTC+01:00 (CET) |
| • Summer (DST) | UTC+02:00 (CEST) |
| Postal codes | 19322 |
| Dialling codes | 038794 |
| Vehicle registration | PR |
| Website | www.cumlosen.de |

History edit
Between 1945 and 1990 Cumlosen served as East German inner German border crossing for inland navigation on the Elbe. The crossing was open for freight vessels navigating between Czechoslovakia, the Soviet Zone of occupation in Germany (till 1949, thereafter the East German Democratic Republic, or West Berlin and the British zone of occupation (till 1949) and thereafter the West German Federal Republic of Germany. The traffic was subject to the Interzonal traffic regulations and that between West Germany and West Berlin was subject to the special regulations of the Transit Agreement (1972).[3]
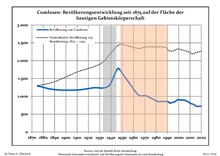
Demography edit
|
|
References edit
- ^ Landkreis Prignitz Wahl der Bürgermeisterin / des Bürgermeisters Archived 2022-01-16 at the Wayback Machine, accessed 2 July 2021.
- ^ "Bevölkerungsentwicklung und Bevölkerungsstandim Land Brandenburg Dezember 2022" (PDF). Amt für Statistik Berlin-Brandenburg (in German). June 2023.
- ^ "Seite wird geladen" (PDF). www.statistik-berlin-brandenburg.de. Retrieved 2023-05-18.
- ^ Detailed data sources are to be found in the Wikimedia Commons.Population Projection Brandenburg at Wikimedia Commons
This Brandenburg location article is a stub. You can help Wikipedia by expanding it. |